Downloads: A PDF of this resource will be available soon.
Related INCOSE Competencies: Toolkit resources are designed to be applicable to any engineering discipline, but educators might find it useful to understand their alignment to competencies outlined by the International Council on Systems Engineering (INCOSE). The INCOSE Competency Framework provides a set of 37 competencies for Systems Engineering within a tailorable framework that provides guidance for practitioners and stakeholders to identify knowledge, skills, abilities and behaviours crucial to Systems Engineering effectiveness. A free spreadsheet version of the framework can be downloaded.
AHEP4 mapping:This resource addresses several of the themes from the UK’s Accreditation of Higher Education Programmes fourth edition (AHEP4): Analytical Tools and Techniques (critical to the ability to model and solve problems), and Integrated / Systems Approach (essential to the solution of broadly-defined problems).
Educational level: Intermediate; Advanced.
Learners have the opportunity to:
Apply systems engineering principles to understand interdependencies between design, manufacturing, and performance.
Use CAD software (e.g. Autodesk Fusion 360) to model and iterate heat sink designs for additive manufacturing.
Explore simulation tools such as Thermal Analysis (Fusion 360) for predicting performance before fabrication.
Engage in design–build–test cycles, fabricating prototypes using metal additive manufacturing and evaluating them experimentally.
Collect and analyse real-time data using LabVIEW and data acquisition systems, linking digital design to physical performance.
Develop collaborative and communication skills through team-based design projects and peer review sessions.
Reflect on sustainability considerations in advanced manufacturing processes.
Teachers have the opportunity to:
Introduce students to complex systems thinking through practical, problem-based, experiential learning activities.
Demonstrate the integration of digital tools and physical testing in a closed-loop design process.
Guide learners in using industry-standard software for design and simulation, reinforcing professional practice.
Facilitate iterative design processes, encouraging students to analyse trade-offs and optimise performance.
Incorporate structured prompts, rubrics, and feedback mechanisms to support critical thinking and design evaluation.
Promote reflection and uncertainty management as part of assessment, linking technical outcomes to systemic insights.
Align activities with INCOSE competencies and AHEP4 themes, ensuring relevance to accreditation and professional standards.
Foster peer learning and collaboration through group work and discussion-based sessions.
Materials and tools required:
This activity utilises both computational design tools and an experimental thermal testing facility to establish a complete system feedback loop:
CAD software (Autodesk Fusion 360) for 3D modelling and design iteration.
Additive manufacturing equipment (metal 3D printer) for prototype fabrication.
Thermal Analysis Tool (Fusion 360) or other CFD simulation software (optional – for design simulation).
Data acquisition system and testing equipment.
The experimental facility integrates the following components:
K-type thermocouples calibrated to ASTM E230 (0–100°C, ±1°C).
Data Acquisition System: NI USB-6210 with custom LabVIEW interface.
Thermal paste: DOWSIL 340 for improved thermal contact.
Computer interface for real-time data recording and analysis.
Learning and teaching resources:
Pre-reading includes literature on additive manufacturing, design for manufacture, and systems thinking in engineering. Students can review the references listed below to learn the fundamentals of heat sinks, guidance on heat sink design, and important considerations.
This teaching activity introduces students to complex systems thinking by having them design, fabricate, and experimentally evaluate additively manufactured heat sinks. It can form part of an advanced manufacturing module, in which learners apply systems engineering principles to understand the interdependencies among design, manufacturing, and performance. The activity demonstrates how complex systems principles—such as feedback, emergence, and uncertainty—manifest in physical engineering systems. Students are guided to see the design–test–evaluate cycle as an iterative, data-driven process that links digital design environments with real-world performance outcomes.
Activity description:
The experiential learning activity links digital design, manufacturing, and physical evaluation using a complex systems framework. Students iterate designs, fabricate prototypes, and measure thermal performance, reflecting on interdependencies and feedback loops.
Session 1: Introduction:
Students are introduced to complex systems and additive manufacturing principles. Variables affecting heat sink performance – geometry, material, surface finish – are identified. The session frames these variables as part of an interconnected thermal management system.
Notes for educators:
Discuss the role of thermal management in high-performance systems.
Provide resources (journal articles, books) for further reading.
Map out factors affecting heat sink efficiency and their systemic relationships, along with the limitations in additive manufacturing.
Introduce complex design thinking concepts, including feedback loops, trade-offs, and uncertainty.
Provide an overview of digital tools (e.g. CAD and simulation software) that support iterative design.
Session 2*: Design and manufacture:
Teams create CAD models in Fusion 360 and prepare designs for metal additive manufacturing. Students analyse trade-offs between thermal performance, printability, and material efficiency, applying complex design thinking to balance competing requirements. Feedback from earlier simulations informs iterative design refinement.
Notes for educators:
Prerequisite knowledge:
Students are expected to be familiar with additive manufacturing processes, including basic 3D printing principles and design-for-manufacture considerations. This ensures that the session focuses on systems thinking and optimisation rather than on manufacturing fundamentals.
Provide design constraints:
Clearly state the size limitations for the heat sink and the capacity of the metal 3D printer, including:
Maximum build volume (e.g. 100 mm × 100 mm × 50 mm).
Minimum wall thickness (e.g. 1.5 mm).
Minimum spacing between fins (e.g. 2 mm).
Provide a design prompt (e.g. “Optimise heat sink geometry for maximum heat dissipation under given constraints”).
Share an evaluation rubric that assesses the following: design rationale, manufacturability, thermal performance, and discussion/reflection, including consideration of environmental and societal impacts.
Encourage peer-review sessions in which teams critique one another’s designs before fabrication.
*Advanced option:
Academics may incorporate Thermal Analysis Tools within Fusion 360 or CFD simulations (e.g. ANSYS Fluent) to evaluate design performance and refine heat sink geometry for optimal efficiency.
Session 3: Experimental set-up and evaluation:
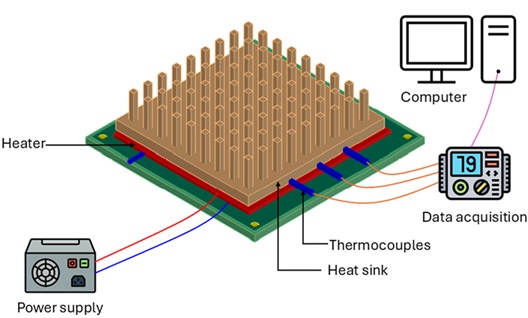
Each prototype is tested using the dedicated testing facility, as shown in Figure 1.
Figure 1: Schematic of the experimental facility for heat sink testing.
The experimental set-up used for evaluating the heat sink performance consists of a DC power supply (i.e. Velleman LABPS3003 30V, 3A), a polyimide-insulated flexible heater (i.e. OMEGA KHLVA-202/40), thermocouples (i.e. K type), a data acquisition system (i.e. NI USB-6210), and a computer for data recording, as shown schematically in Figure 1. A flexible heater is mounted beneath the heat sink, powered by a DC supply to simulate heat generation in microprocessors. Thermocouples are positioned at the heat sink base and calibrated to ASTM E230. A DOWSIL 340 thermal paste layer ensures optimal thermal contact. This enables accurate measurement of the thermal performance of fabricated heat sinks under controlled heat flux conditions.
Session 4: Data analysis and comparison:
A custom LabVIEW interface is developed to acquire, visualise, and log temperature and power data in real time, thereby providing a digital bridge between the physical test rig and the data analysis environment. Temperature and power data are acquired using LabVIEW with the NI USB-6210 DAQ card.
The evaluation and comparison of thermal performance among heat sink geometries designed by various student groups are conducted by recording the base temperature of each configuration as a function of time under a constant heat flux and identical ambient conditions. The transient temperature response, illustrated in Figure 2 (a), provides insight into the rate at which each design approaches steady state, whereas the steady-state base temperature indicates its overall heat dissipation capability. This procedure can be applied to any heat sink to assess and compare its thermal behaviour.
Figure 2: (a) Transient base temperature variation with time for the reference and three heat sink configurations. (b) Enhanced heat dissipation relative to the reference block, illustrating the method used to compare thermal performance across different designs.
Students compare results and interpret the impact of geometry on heat dissipation. They connect observed variations to systemic dependencies between design, manufacture, and experimental performance.
The computed enhancement values, shown in Figure 2 (b) allow direct comparison of heat dissipation efficiency among the different designs. By examining both the temperature–time response and the enhancement ratio, the effect of geometric modification on thermal performance can be quantitatively assessed within a unified experimental framework.
The experimental facility thus forms a closed digital loop connecting design, fabrication, and performance evaluation. The data acquired through LabVIEW and the DAQ system feed back into the design process, enabling iterative optimisation of heat-sink geometry and thermal-management strategies.
Session 5: Reflection:
Teams map out interdependencies between process variables, performance metrics, and uncertainties. They construct feedback diagrams (flowcharts) using Microsoft PowerPoint SmartArt, linking design iterations, measurements, and outcomes to identify emergent system behaviour.
Assessment and reflection:
The assessment can comprise a reflective report and a presentation.
Reports should include:
Interpretation of experimental data and comparison of thermal performance across designs.
Evaluation of system feedback mechanisms, showing how design decisions influenced outcomes.
Discussion of uncertainty management, including:
Identifying sources of uncertainty (e.g. measurement errors, material properties, environmental conditions).
Explaining how these uncertainties were considered during design iterations and testing.
Reflecting on strategies to mitigate uncertainty (e.g. calibration, repeated trials, simulation validation).
Considering the impact of uncertainty on decision-making and overall system performance.
Presentations should summarise:
The design evolution and rationale for changes.
System mapping to illustrate interdependencies and feedback loops.
Insights into complex systems behaviour, including how uncertainty shaped design choices.
Additional image:Heatsink fabricated using a metal 3D printer.
Any views, thoughts, and opinions expressed herein are solely that of the author(s) and do not necessarily reflect the views, opinions, policies, or position of the Engineering Professors’ Council or the Toolkit sponsors and supporters.
Related INCOSE Competencies: Toolkit resources are designed to be applicable to any engineering discipline, but educators might find it useful to understand their alignment to competencies outlined by the International Council on Systems Engineering (INCOSE). The INCOSE Competency Framework provides a set of 37 competencies for Systems Engineering within a tailorable framework that provides guidance for practitioners and stakeholders to identify knowledge, skills, abilities and behaviours crucial to Systems Engineering effectiveness. A free spreadsheet version of the framework can be downloaded.
This resource relates to the Systems Thinking, Systems Modelling and Analysis, Integration, and Technical Leadership INCOSE competencies.
AHEP4 mapping: This resource addresses several of the themes from the UK’s Accreditation of Higher Education Programmes fourth edition (AHEP4): Analytical Tools and Techniques (critical to the ability to model and solve problems), and Integrated / Systems Approach (essential to the solution of broadly-defined problems).
Educational level: Beginner; Intermediate.
Learning and teaching notes:
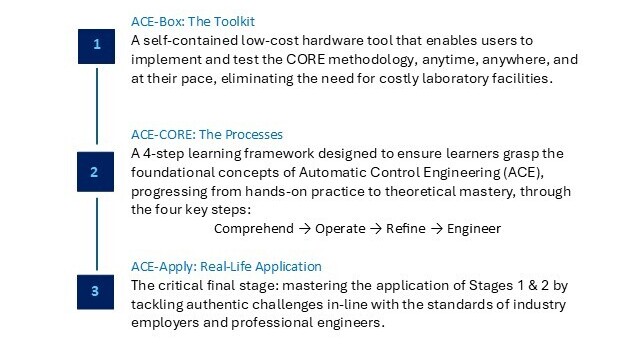
Modern engineering is increasingly digital, interconnected, and system oriented. To prepare students for this evolving landscape, the Automatic Control Engineering (ACE) Model offers a systems-driven, application-focused framework for practical control engineering education. Developed through a MathWorks-funded project launched in the summer of 2025, the ACE-Model unifies three complementary components that together cultivate systems thinking and model-based systems engineering competence:
ACE-Box: The Toolkit
ACE-CORE: The Processes
ACE-Apply: Real-World Application
Learners have the opportunity to:
Engage with the entire ACE-CORE (Comprehend – Operate – Refine – Engineer) framework.
Experience a welcoming and accessible introduction to ACE, without an early overemphasis on mathematics. This stands in contrast to the traditional approach, where topics such as Laplace transforms are introduced early on, often creating unnecessary barriers to engagement (Abou-Hayt and Dahl, 2023).
Develop systems awareness and motivation.
Develop confidence, engagement, and curiosity.
Gain the technical knowledge and systems integration mindset required to thrive in the complex, adaptive landscape of digital engineering.
Teachers have the opportunity to:
Introduce control theory topics in a way that addresses the concern of students finding it difficult to link abstract control theory with the world of control engineering practice(Rossiter, 2022; Badau, et al., 2024).
Introduce industry-standard systems processes such as the V-diagram and model-based design workflows.
Progressively link theory to practice.
Support AHEP4 expectations for developing graduates who can apply integrated systems approaches to solving complex problems and the INCOSE Systems Engineering Competency areas of systems thinking, integration, and technical leadership.
What does the ACE-Model consist of?:
Figure 1:The ACE-Model: Integrating the Toolkit (ACE-Box), with the Processes (ACE-CORE), to Lead to the Real-Life Application (ACE-Apply) to build a progressive mastery in Automatic Control Engineering (ACE).
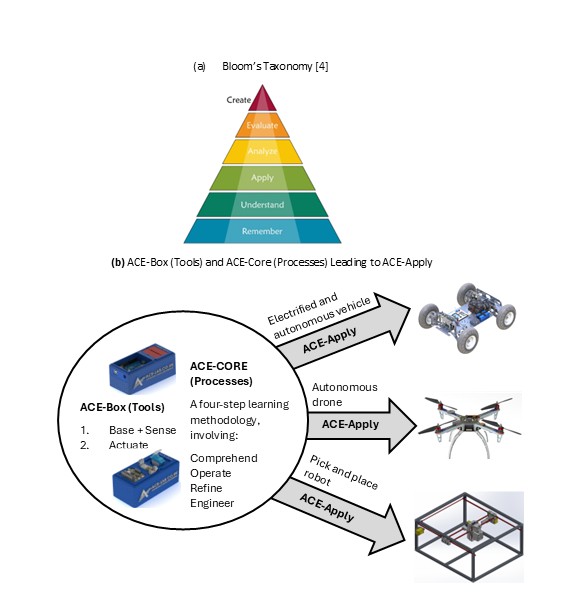
The ACE-Model is closely aligned with Bloom’s Taxonomy, see (Anderson and Krathwohl, 2001)and Figure 2(a) providing a structured pathway for students to progress through the cognitive hierarchy, while developing capabilities across multiple levels of system abstraction. Figure 2(b) offers a schematic view of the three stages of the ACE-Model, as introduced in Figure 1. An initial overview of the ACE-Model is presented here, with further details provided in the following sections.
The ACE-Box is a portable, self-contained hardware tool that brings ACE to life beyond the traditional costly, full-scale laboratories. All that is required is a laptop and the ACE-Box. Designed to support the ACE-CORE methodology, ACE-Box can be set up on a desk, in a classroom, or even at home. MATLAB and Simulink serve as the primary platforms for model-based design, enabling system modelling, control system development, and the deployment of control algorithms to physical hardware (e.g. Arduino Uno) through code generation tools.
ACE-CORE guides learners through successive levels of Bloom’s framework:
Comprehend aligns with Remember and Understand on the Bloom Taxonomy, enabling students to grasp the applications of control engineering before advancing.
Operate corresponds to Apply on the Bloom Taxonomy, as students engage directly with control systems, supported by Stage 2, making use of the ACE-Box (hardware or virtual).
Refine maps to both Analyse and Evaluate on the Bloom Taxonomy, where learners diagnose performance, compare outcomes, and adapt solutions to meet stakeholder requirements.
Engineer extends this process to system-level design and synthesis, making use of modelling and simulation tools such as MATLAB and Simulink. At this stage, students revisit the full cycle (Remember through to Evaluate), but at a higher level of integration with the use of control theory, again supported by the ACE-Box.
At each stage of CORE, learners move from recognising system components to synthesising complex interactions, mirroring the systems engineering lifecycle from requirement capture through verification and validation. This alignment supports AHEP4’s emphasis on analytical and problem-solving competence and INCOSE’s System Definition and Integration competencies.
Finally, learners progress to Create, the highest stage of Bloom’s Taxonomy, by applying their knowledge to design complete control systems for real-world applications such as drones, vehicles, and automation systems. In this way, the ACE-Model scaffolds learning in parallel with Bloom’s progression, from foundational comprehension to advanced problem-solving, design and innovation.
Together, these three pillars form a cohesive learning ecosystem: the toolkit, the process, and the application.
Figure 2:Bloom’s Taxonomy (Anderson and Krathwohl, 2001)(a) and the ACE-Model Three Stages (b).
Collaborative community:
The ACE-Model ‘sits’ within the ACE-Lab, a collaborative community of academics and industry professionals committed to developing, validating, and disseminating open-access systems education resources. The ACE-Lab approach embodies complex adaptive systems principles, where the community evolves through continuous feedback, iteration, and co-design. Membership to the ACE-Lab is open to anyone who shares our vision of advancing control engineering teaching tools and practices. Through this approach, the ACE-Model equips graduates with the knowledge and hands-on skills required to excel in modern ACE careers. Find out more about the ACE-Lab through the following website:www.ace-lab.co.uk
As an evolving community, ACE-Lab continually expands its open-access content through the active contributions of its members. New materials are regularly developed and shared, ensuring the resources remain current and relevant. Through this dynamic, collaborative approach, embodied in the ACE-Model, students not only gain technical knowledge but also develop the capacity to understand, navigate, and work effectively with complex, interconnected engineering systems.
ACE-Box: The toolkit:
The ACE-Box is based on the early development work of Control-Lab-in-a-Box(Pickering, 2023; 2025). CLB integrates sensors, actuators, and microcontroller to allow students to experience dynamic behaviour, and feedback control.
For now, two ACE-Box kits have been developed:
1. Base and sense
2. Actuate
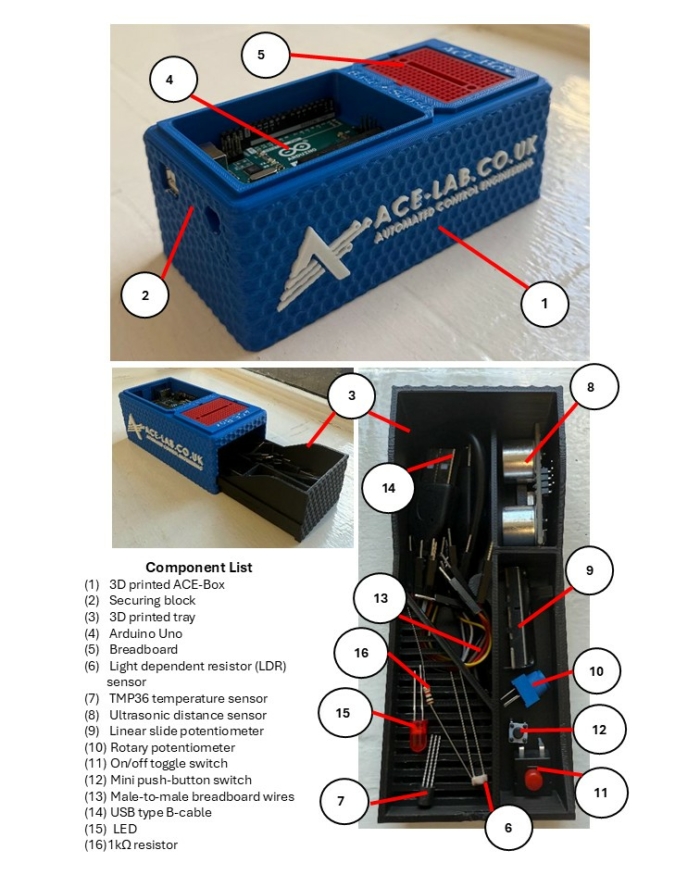
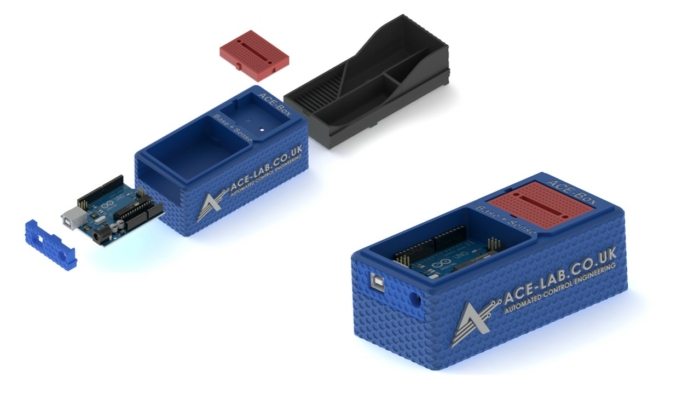
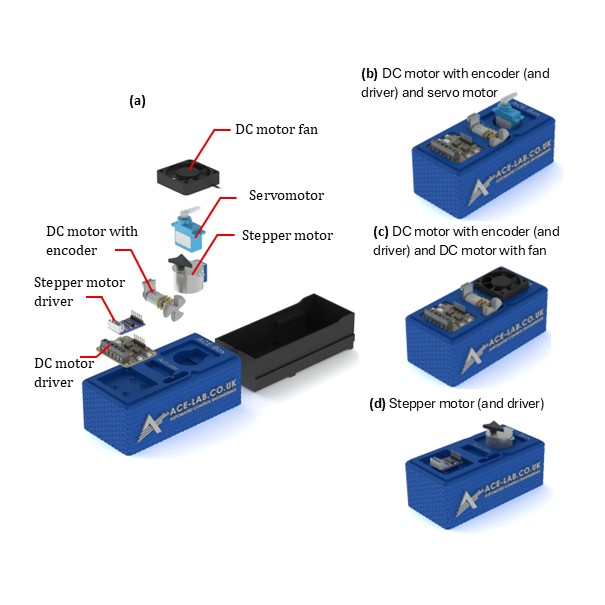
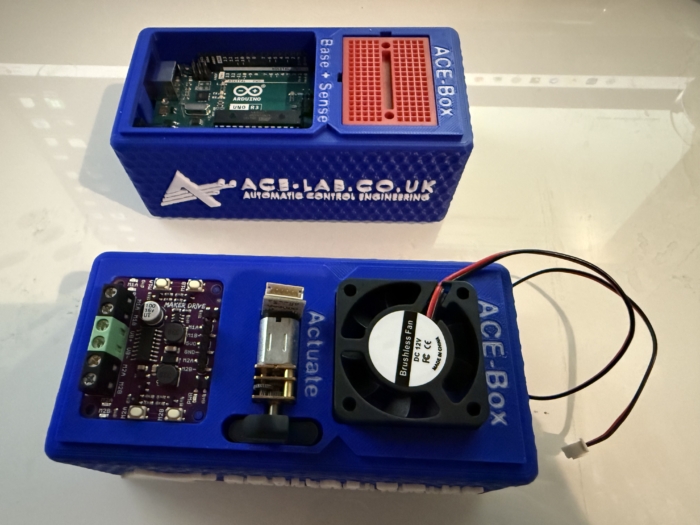
The ACE-Box (base and sense) is illustrated in Figure 3, with the 15 key components labelled, along with an exploded view of the main parts in Figure 4. The ACE-Boxesintegrate the essential microcontrollers, electronics, sensors, and actuators needed to design, implement, and test elements of digital control algorithm development, e.g. control algorithms in real time. It bridges the gap between theory and practice, allowing learners to see how abstract concepts behave in physical systems. The ACE-Box is also available as an open-access resource, with laboratory exercises included, with details provided later in this article. The ACE-Box (labelled (1) in Figure 3) and the tray (labelled (2) in Figure 3) are manufactured using 3D printing, with the necessary files available on the project website referenced above. A list of the required components and their sources is also provided on the project website, corresponding to labels (3) to (15) in Figure 3. Due to the open-source design of ACE-Lab, the library of exercises will continue to expand, supported by contributions from both academia and industry. The ACE-Box (Actuate) is illustrated in Figure 5, with the key actuator components detailed in (a), along with some typical lab set-ups (b, c and d). Figure 6 illustrates both the ACE-Box (Base + Sense) and also ACE-Box (Actuate).
Figure 3:The ACE-Box (Base and Sense).
Figure 4: Assemble of the 3D Printed ACE-Box (Base and Sense).
Figure 5:The ACE-Box (Actuate).
Figure 6:ACE-Box (Actuate) Alongside the ACE-Box (Base + Sense).
ACE-CORE: The methodology:
ACE-CORE is a four-step framework designed to scaffold learning from components to system-of-systems understanding:
Comprehend: Recognise the interdependencies between components within a feedback control system.
Operate: Discover how to operate a control system from understanding system requirements to testing and validation.
Refine: Diagnose, analyse, and optimise performance using feedback principles; students apply system verification and validation approaches.
Engineer: Apply mathematics and modelling to synthesise control algorithms and architectures that achieve desired system behaviours.
The methodology explicitly develops systems thinking, and integrationcompetencies, core to both AHEP4 and INCOSE frameworks.
ACE-CORE is intentionally designed to offer a scaffolded learning experience, allowing students to build confidence step by step as they deepen their understanding. Due to its flexible structure, students can also follow a completely practical route, i.e. avoiding the modelling and simulation. The emphasis is not on rote memorisation of theory, but on progression through understanding the fundamentals of control engineering, e.g. the components that form a feedback control system.These routes enable learners to apply concepts in practical control engineering contexts and develop genuine competence.
ACE-Apply: Real-world application:
ACE-Apply is the project stage, where the skills and knowledge gained from ACE-Box and ACE-CORE are consolidated by tackling authentic challenges aligned with the expectations of industry and professional engineers, see Figure 2(b). At this stage, learners prove their mastery by addressing engineering application problems that reflect the standards of industry practice. The focus is on:
Applying the ACE-CORE methodology to practical control application challenges across domains such as robotics, automotive systems, drones, and industrial automation.
Bridging theory, simulation, and hardware with confidence and agility using industry standard tools and processes.
This stage reinforces AHEP4 Themes 3 and 5, particularly:
Applying integrated systems approaches to complex, real-world problems.
Managing system lifecycle activities including requirements capture, design, testing, and validation.
It also strengthens INCOSE competencies in System Realisation, Integration, and Technical Project Management, encouraging students to act as systems integrators capable of managing interfaces and dependencies across mechanical, electrical, and software domains.
By bridging theory, simulation, and hardware using industry-standard digital tools, ACE-Apply nurtures the ability to navigate complex adaptive systems, anticipate emergent behaviour, and work collaboratively within multidisciplinary engineering ecosystems.
ACE-Box activities:
Upon visiting the ACE-Lab website (www.ace-lab.co.uk), under the tab ‘ACE-Box’, the following tabs exist (with the links provided):
The “What is the ACE-Box?” page introduces educators and students to the ACE-Box platform, outlining its purpose, key features, and practical considerations such as sourcing components and 3D-printing enclosure parts.
The “Prior Exercises” page provides essential onboarding material designed to help users become familiar with MATLAB and Simulink. This includes links to the relevant OnRamp courses, guidance on installing the required software packages, and short tutorial videos that introduce the MATLAB and Simulink graphical user interfaces (GUIs).
The “Base + Sense” section contains a set of introductory tutorial exercises that use the ACE-Box (Base + Sense configuration). These activities help users get started with Simulink code generation for the Arduino Uno, while working with a range of basic sensors and electronic components.
Finally, the “Base + Sense + Actuate” section builds on the previous material by introducing actuation hardware. Using both the Base + Sense and Actuate modules, students and educators learn how to interface with and control devices such as DC motors, servomotors, and stepper motors. This section is designed to familiarise users with actuator integration and reinforce practical control engineering workflows.
Example use of ACE-Box (Base + Sense):
To demonstrate the use of the ACE-Box (Base + Sense), an introductory activity is provided, i.e. the on-off blinking of an LED. Prior to this activity, through ACE-CORE, students should receive a short introduction to microcontrollers covering key concepts such as digital input/output pins, analogue pins, and pulse-width modulation (PWM). Once students are familiar with these fundamentals, they progress to the initial exercise detailed here, which is aligned with defined learning outcomes.
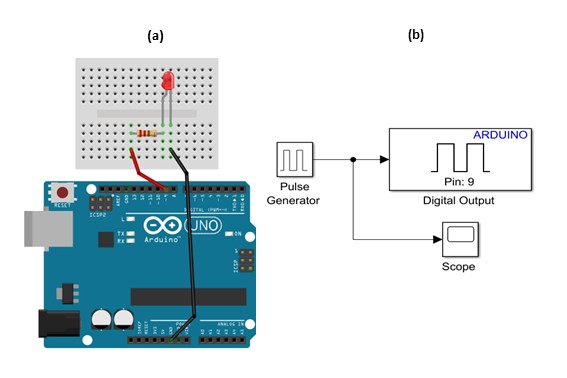
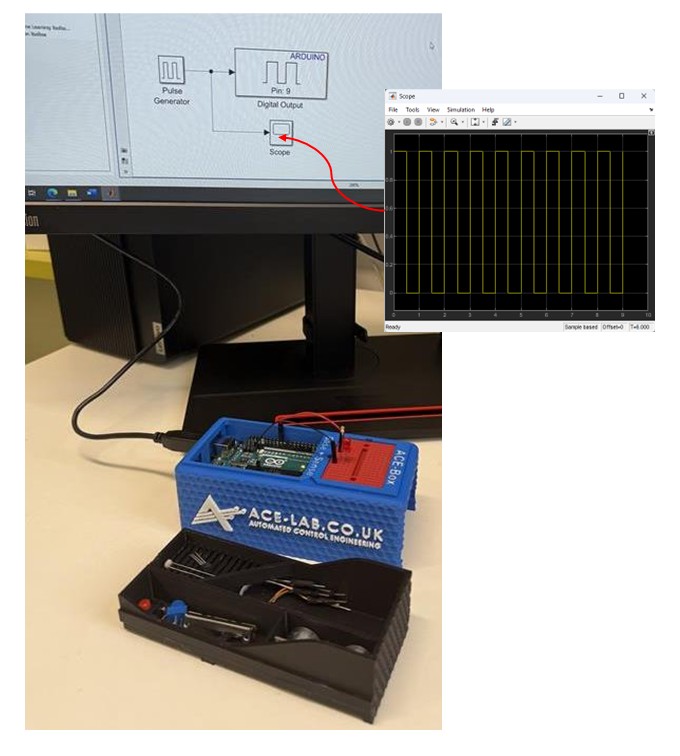
Since MATLAB and Simulink are the primary software tools used with the ACE-Box, students are first guided through installing the Simulink Support Package for Arduino Hardware. After the hardware and software setup is complete, they assemble a simple circuit, see Figure 7(a), and configure a Simulink model for the first exercise, see Figure 6(b). This initial activity requires students to control the state of a digital output pin on the Arduino, switching it on and off. The Simulink model, provided in Figure 7(b), enables students to quickly build the exercise using a visual programming approach. To run the activity, they follow a sequence of steps that includes code generation, which compiles the Simulink model into embedded C code and deploys it onto the Arduino Uno microcontroller. Once completed, the LED connected to the circuit blinks on and off according to the settings of the Simulink pulse generator. A visual of the complete set-up for this initial exercise can be found in Figure 8. At this stage, students are encouraged to experiment with the pulse generator parameters in real-time, observing how changes to the signal properties immediately affect the LED’s behaviour. Scopes can also be used (see Figure 7(b)) to visualise the pulse generator’s square-wave output, including its amplitude, period, and pulse width. This hands-on interaction reinforces the link between the initial set-up and hardware implementation while deepening their understanding of microcontrollers.
Figure 7:LED Simple Circuit (a) and Simulink for Code Generation for the on-off Blinking of an LED.
Figure 8:LED Simple Circuit Set-Up using Simulink for Code Generation for on-off Blinking of an LED.
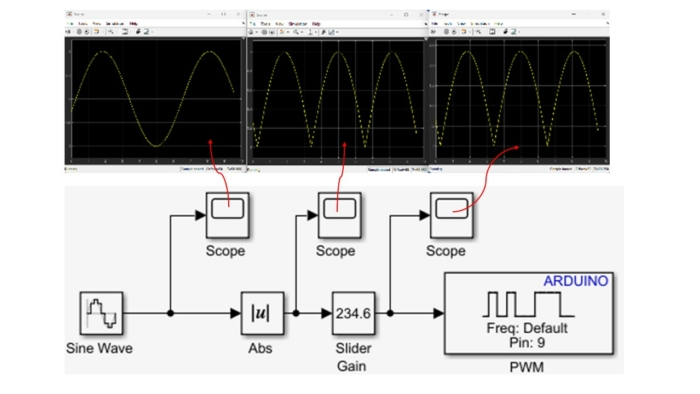
The initial exercise is designed to familiarise students with the ACE-Box and the use of Simulink’s code generation tools. This type of activity is typical for introducing students to a new software and hardware environment. The next exercise involves using pulse width modulation (PWM) to vary the brightness of the LED. This exercise involves using additional blocks in Simulink, see Figure 8, where multiple scopes are used to visualise the signals in real-time. Once students understand the fundamental building blocks of Simulink, they can quickly progress to developing feedback control systems that meet a variety of application requirements. In the authors’ view, student familiarity with Simulink makes it a more accessible platform for designing advanced control algorithms, particularly when working with sub-systems.
Figure 9:LED Simple Circuit Set-Up using Simulink for Code Generation Varying Brightness of an LED using Pulse Width Modulation (PWM).
Building on this foundation, a wide range of laboratory exercises can be developed using the electronic components involved in ACE-Box (Base + Sense), as illustrated in Figure 3, with the option to expand further by incorporating additional components. Examples of extended exercises include:
Analogue sensing and calibration with a temperature sensor
LDR characterisation and linearisation using a voltage divider
Analogue sensing and calibration with a potentiometer sensor
Digital sensing using an ultrasonic sensor
Distance-reactive LED control with proportional feedback (human-in-the-loop plant)
Closed-loop brightness control using LDR feedback and LED PWM
LED–LDR plant control experiments
In addition to sensing activities, the ACE-Box (Actuate) provides four actuators: a servomotor, a DC motor with encoder, a stepper motor, and a DC motor fan. This unit can be used independently or in combination with the Base and Sense ACE-Box to enable more advanced control experiments, such as DC motor speed control or motor control based on light intensity measurements from an LDR.
The flexibility of the ACE-Box system ensures that the number of possible exercises is effectively unlimited, as new experiments can be designed by combining existing sensors and actuators or by integrating additional measurement devices. This also allows unique coursework assignments to be created.
Summary:
The ACE-Model provides a systemic and holistic framework for practical control engineering education that:
Fosters systems thinking and model-based design literacy aligned with INCOSE and AHEP4 competencies.
Connects abstract control theory to complex, real-world systems through accessible hands-on experiences.
Encourages progression from component-level comprehension to system integration.
Builds confidence and motivation through authentic engagement with digital and physical systems, preparing graduates for engineering practice in a complex, interconnected world.
Acknowledgements:
Dr James E. Pickering gratefully acknowledges the support from MathWorks, whose funding made this project possible. He also extends his sincere thanks to Hari Sudeskkumar for his exceptional engineering design contributions and 3D-printing work. The authors would like to thank the Project Advisory Group (PAG) for their valuable guidance throughout the development of this work.
References:
Abou-Hayt, I. and Dahl, B., 2023. A Critical Look at the Laplace Transform Method in Engineering Education. IEEE Transactions on Education, 67(4), pp.542-549.
Anderson, L.W. and Krathwohl, D.R., 2001. A taxonomy for learning, teaching, and assessing: A revision of Bloom’s taxonomy of educational objectives: complete edition. Addison Wesley Longman, Inc..
Badau, N.E., Popescu, T.M., Mihai, M., Dulf, E.H. and Muresan, C.I., 2024. Bridging the gap between control theory and practice: From simple controller design to a practical microcontroller implementation. IFAC-PapersOnLine, 58(26), pp.124-129.
Pickering, J.E., 2023. Control-Lab-in-a-Box: Bridging the Gap between Control Theory and Engineering Practice. In UK and Ireland Engineering Education Research Network Conference Proceedings 2023.
Pickering, J.E., 2025. Leveraging Control-Lab-in-Box (CLB) to Teach Control Engineering on Future Vehicle Technologies MSc. IFAC-PapersOnLine, 59(7), pp.31-35.
Rossiter, J.A., 2022. Future trends for a first course in control engineering. Frontiers in Control Engineering, 3, p.956665.
Any views, thoughts, and opinions expressed herein are solely that of the author(s) and do not necessarily reflect the views, opinions, policies, or position of the Engineering Professors’ Council or the Toolkit sponsors and supporters.
Related INCOSE Competencies: Toolkit resources are designed to be applicable to any engineering discipline, but educators might find it useful to understand their alignment to competencies outlined by the International Council on Systems Engineering (INCOSE). The INCOSE Competency Framework provides a set of 37 competencies for Systems Engineering within a tailorable framework that provides guidance for practitioners and stakeholders to identify knowledge, skills, abilities and behaviours crucial to Systems Engineering effectiveness. A free spreadsheet version of the framework can be downloaded.
This resource relates to the Systems Thinking, Systems Modelling and Analysis and Critical Thinking INCOSE competencies.
AHEP mapping: This resource addresses several of the themes from the UK’s Accreditation of Higher Education Programmes fourth edition (AHEP4): Analytical Tools and Techniques (critical to the ability to model and solve problems), and Integrated / Systems Approach (essential to the solution of broadly-defined problems). In addition, this resource addresses the AHEP themes of Design and Practical and workshop skills.
Educational level: Intermediate; Advanced.
Learning and teaching notes:
This activity is suitable for those having acquired some familiarity with complex systems and related concepts – especially causal loop diagrams, stock and flow diagrams, cognitive maps or participatory maps – who are looking for additional ideas for activities or who have a specific interest in participatory modelling. The activity is also useful at the point when students learn about interaction between different elements of a complex system or when they learn about the importance of human factors.
Learners have the opportunity to:
Deepen their understanding of systems thinking.
Engage with participatory modelling.
Enjoy a fun group activity.
Teachers have the opportunity to:
Introduce students to participatory modelling (i.e. more specifically to participatory system dynamics / group model-building).
Develop students’ understanding of stock-and-flow modelling in the tradition of system dynamics.
Support students’ understanding of complex interactions around urban dynamics, and if adapted also around other contexts.
This activity introduces students to a participatory systems thinking – or more specifically – participatory modelling exercise. This is an approach used in group settings to explore complex issues and represent them via models. In this activity, students assume the roles of stakeholders involved in an urban regeneration project and take part in a group model-building workshop.
It teaches students core principles of a participatory modelling method called group model-building or participatory system dynamics, but it can also be used to teach the underlying system structure of a specific phenomenon. This makes it well-suited for modules that contain elements of systems thinking and system dynamics (including causal loop diagramming and simulation modelling) or modules that contain an element on group facilitation and participatory methods.
The activity is designed to run over 1.5 to 2.5 hours and is adaptable. While the current example focuses on the phenomenon of urban dynamics around the population development in a city, the activity can be reframed using a case and model from a project management, water management, energy or other sustainability-related context.
The activity is directly aligned with systems thinking by immersing students in a participatory modelling process. It develops students’ awareness of system content and its interactions by teaching them qualitative modelling skills. It develops their skills in managing complexity and representing system elements with visual models consisting of items and their relationships depicted in causal loop diagrams and/or stock and flow diagrams. This serves to build students’ analysis skills and ability to apply systems approaches to problems. It also develops their practitioner, practical and workshop skills of collaborating with stakeholders. It does so by advancing their facilitation skills essential for collaborative systems work. This includes rules of conduct and techniques for managing a group discussion and group dynamics, making a broad range of ideas heard, prioritising them and mapping them visually.
Miro (free version available with up to three active boards)
MURAL or similar platforms (depending on institutional access)
If software or an online tool are used, these are used to collate concepts (variables suggested by students) and to build a diagram of their interactions. This will be projected to the in-person and/or online participants, replicating the participatory nature of in-person workshops.
Detailed explanation of the activity:
This activity introduces students to participatory modelling, an approach used in group settings to explore and understand complex issues and represent them via models. In this case, participatory modelling is introduced through a structured group model-building workshop, using a simplified version (Alfeld & Graham, 1976; Richardson, 2014) of Jay Forrester’s (1969) famous Urban Dynamics model, which sparked quite some debate because of its counter-intuitive insights. The session begins with a brief historical overview of urban growth and decline in major cities up to the 1980s (e.g. New York, Boston, London; see files under ‘Downloads’, above), before focusing on the London Docklands in London in 1981, as an example of an opportunity for urban redevelopment to counter the trend of population decline. Student groups are assigned stakeholder roles from that time, including the founder of the London Docklands Development Corporation (1–2 students), the Surrey Quays Housing Action Group (2–6 students), the London Chamber of Commerce (2–6 students) and the Greater London Council (2–6 students). Each student group receives a role sheet outlining their perspective and a small set of key variables relevant to their stakeholder position (see linked files). These variables are intentionally curated to align with the Urban Dynamics model and to ensure that collaboration is necessary to draw the interlinkages between the variables, i.e. the relevant system structure.
A list of variables provided to the student groups via the role sheets is included below. Note that not all variables that are necessary to draw the model are included; students need to infer a few variables to train their thinking.
London Docklands Development Corporation
Population (This is the total number of people living in the city. As the variable represents the sum of all people, it is an integral. Specific pictogram language can highlight this. In the tradition of system dynamics modelling, one would therefore put a rectangle around it, which the teacher can do after the variable has been placed on the board.)
Surrey Quays Housing Action Group
Housing Structures (Indicates the number of dwellings. Housing is important for urban development. As the variable represents the sum of all dwellings, it is also an integral, which would be depicted by a rectangle.)
Ratio of households to housing (This variable is an indicator of crowding. Ideally, there is one household per housing structure. A number above one means that some people need to live in shared places. A number below one means that there is vacant housing.)
London Chamber of Commerce
Business structures (Indicates the number of business units. Businesses are important to urban development. As the variable represents the sum of all business units, it is also an integral, which would be depicted by a rectangle.)
Jobs (Total number of jobs available in the city (whether filled or unfilled).
Greater London Council
Population (Repeated variable to be able to compare between groups.)
Net migration (Change in population. The simple model excludes population changes by births and deaths because of the relative larger changes by national and international migration.)
Jobs (Repeated variable to be able to compare between groups.)
Before the workshop begins, students are introduced to core concepts of participatory modelling (see linked slides), including facilitator roles (based on Richardson & Andersen, 1995) and common workshop scripts (e.g. hopes and fears, variable elicitation, voting, model building, policy option elicitation and system storytelling, as described in Scriptapedia and Andersen & Richardson, 1997).
The workshop proceeds in three main phases:
1. Variable elicitation: After a short introduction by the student playing the founder of the London Docklands Development Corporation into the setting and by the facilitator/teacher into the process, each group sketches behaviour-over-time graphs of their assigned variables (10 minutes). These are presented using a round-robin or nominal group technique, meaning one variable per group at a time only, and placed on a whiteboard/blackboard or digital canvas. The round-robin collection is a technique useful to foster inclusivity and avoid talking heads. Behaviour-over-time graphs rather than just variable names are useful because the final model is believed to explain a behavioural trend over time, linking model structure and dynamics. However, it is also possible to simplify by letting students just write the variable names on sheets of paper.
2. Voting and prioritisation: To decide on a starting point for modelling, each student votes on which variables they consider to be the most important to include in the model, e.g. giving the students as many votes as there are variables on the board and freedom of how to distribute their votes. While all variables will be included in the model, the voting activity provides a basis for reflection on different priorities and students’ personal vs. their group’s perspective, after the modelling activity.
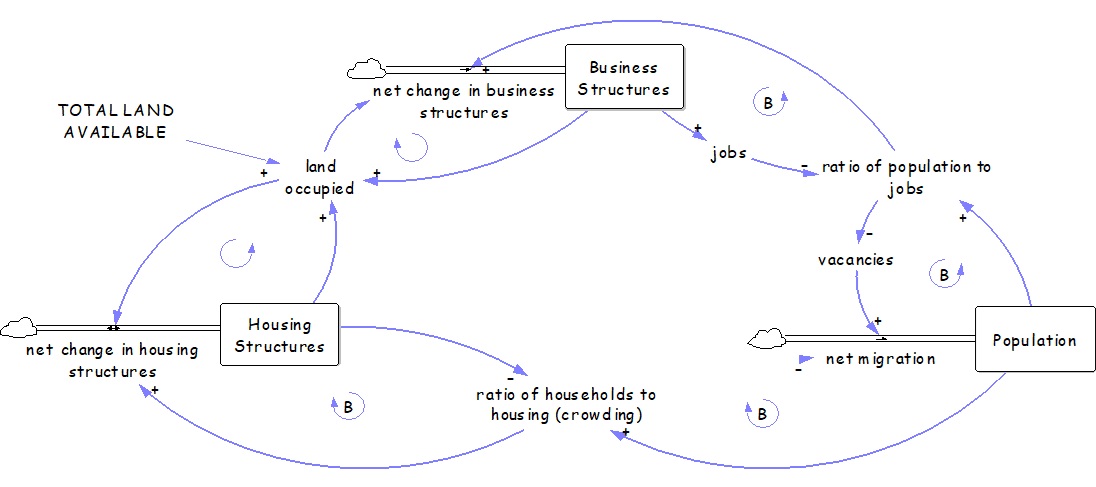
3. Model building: The class collaboratively constructs a stock and flow diagram (see Figure 1). Stocks such as Housing Structures, Business Structures, and Population are identified, and their net rates of change are discussed. To connect the variables, some more variables need to be added such as the ratio of population to jobs, total land available, and land occupied. To help students identify these variables, the teacher can ask questions: “Population and housing are linked by a ratio. What concepts and respective variables could link the other stocks?”. Students are encouraged to identify feedback loops and classify them as reinforcing or balancing.
It is useful to pay attention to uncovering less obvious relationships, such as the spatial competition between housing and business infrastructure. Once the diagram is complete, the facilitator reviews the model with the class, highlighting key feedback structures.
After the modelling activity, students can be shown images of the Docklands after the redevelopment as well as urban population trends of London and other major cities until today, prompting discussion on the long-term impacts of different types of development and prioritisation of a business vs. housing focus. The session can conclude with a reflection on the participatory process and its relevance to real-world decision-making and the value of participatory modelling in complex policy environments.
A more comprehensive version of this activity – including a more introductory group model-building exercise that teaches basic causal loop diagramming concepts and an alternative context using project management as an example – is available: https://discovery.ucl.ac.uk/id/eprint/10160261/
Figure 1: Stock and flow diagram of urban dynamics (produced with Vensim software). This figure is intended for educators and serves an illustrative purpose. It provides educators with a reference for how the model built during the activity is expected to look.
Note: The author was originally inspiredto focus on this case by the historical accounts found on the London Docklands Development Corporation (LDDC) History Pages (http://www.lddc-history.org.uk/index.html, nowinactive).
References:
Alfeld LE, & Graham AK. 1976. Introduction to Urban Dynamics. Cambridge, MA: Productivity Press.
Andersen DF, & Richardson GP. 1997. Scripts for group model building. System Dynamics Review 13(2): 107–129.
Antunes P, Stave K, Videira N, & Santos R. 2015. Using participatory system dynamics in environmental and sustainability dialogues. In M. Ruth (Ed.), Handbook of Research methods and Applications in Environmental Studies. Edward Elgar Publishing: Cheltenham, UK: 346–374.
Deaton M, & MacDonald R. 2025. System Dynamics Learning Guide. Harrisonburg, VA: James Madison University Libraries.
Zimmermann, N. 2026 (forthcoming). Weaving participatory modelling into teaching: Purposes and practices from system dynamics education. Systems Dynamics Review.
Any views, thoughts, and opinions expressed herein are solely that of the author(s) and do not necessarily reflect the views, opinions, policies, or position of the Engineering Professors’ Council or the Toolkit sponsors and supporters.
Licensing:This work is licensed under a Creative Commons Attribution-ShareAlike 4.0 International License. It is based upon the author’s 2025 article “A Simulation Tool for Pinch Analysis and Heat Exchanger/Heat Pump Integration in Industrial Processes: Development and Application in Challenge-based Learning”. Education for Chemical Engineers 52, 141–150.
Related INCOSE Competencies: Toolkit resources are designed to be applicable to any engineering discipline, but educators might find it useful to understand their alignment to competencies outlined by the International Council on Systems Engineering (INCOSE). The INCOSE Competency Framework provides a set of 37 competencies for Systems Engineering within a tailorable framework that provides guidance for practitioners and stakeholders to identify knowledge, skills, abilities and behaviours crucial to Systems Engineering effectiveness. A free spreadsheet version of the framework can be downloaded.
This resource relates to the Systems Thinking, Systems Modelling and Analysis and Critical Thinking INCOSE competencies.
AHEP mapping: This resource addresses several of the themes from the UK’s Accreditation of Higher Education Programmes fourth edition (AHEP4): Analytical Tools and Techniques (critical to the ability to model and solve problems), and Integrated / Systems Approach (essential to the solution of broadly-defined problems). In addition, this resource addresses the themes of Science, mathematics and engineering principles; Problem analysis; and Design.
Educational level: Intermediate.
Educational aim:To equip learners with the ability to model, analyse, and optimise pathways for industrial decarbonisation through a complex-systems lens – integrating technical, economic, and policy dimensions – while linking factory-level design decisions to wider value-chain dynamics, multi-stakeholder trade-offs, and long-term sustainability impacts.
Learning and teaching notes:
This teaching activity explores heat integration for the decarbonisation of industrial processes through the lens of complex systems thinking, combining simulation, systems-level modelling, and reflective scenario analysis. It is especially useful in modules related to energy systems, process systems, or sustainability.
Learners analyse a manufacturing site’s energy system using a custom-built simulation tool to explore the energy, cost and carbon-emission trade-offs of different heat-integration strategies. They also reflect on system feedback, stakeholder interests and real-world resilience using causal loop diagrams and role-played decision frameworks.
This activity frames industrial heat integration as a complex adaptive system, with interdependent subsystems such as process material streams, utilities, technology investments and deployments, capital costs, emissions, and operating constraints.
Learners run the simulation tool to generate outputs to explore different systems integration strategies: pinch-based heat recovery by heat exchangers, with and without heat pump-based waste heat upgrade. Screenshots of the tool graphical user interface are attached as separate files:
The learning is delivered in part, through active engagement with the simulation tool. Learners interpret the composite and grand composite curves and process tables, to explore how system-level outcomes change across various scenarios. Learners explore, using their generated simulation outputs, how subsystems (e.g. hot and cold process streams, utilities) interact nonlinearly and with feedback effects (e.g., heat recovery impacts), shaping global system behaviour and revealing leverage points and emergent effects in economics, emissions and feasibility.
Using these outputs as a baseline, and exploring other systems modelling options, learners evaluate trade-offs between heat recovery, capital expenditure (CAPEX), operating costs (OPEX), and carbon emissions, helping them develop systems-level thinking under constraints.
The activity embeds scenario analysis, including causal loop diagrams, what-if disruption modelling, and stakeholder role-play, using multi-criteria decision analysis (MCDA) to develop strategic analysis and systems mapping skills. Interdisciplinary reasoning is encouraged across thermodynamics, economics, optimisation, engineering ethics, and climate policy, culminating in reflective thinking on system boundary definitions, trade-offs, sustainability transitions and resilience in industrial systems.
Learners have the opportunity to:
Analyse non-linear interactions in thermodynamic systems.
Reconcile conflicting demands (e.g. energy savings vs costs vs emissions vs technical feasibility) using data generated from real system simulation.
Model and interpret feedback-driven process systems using pinch analysis, heat recovery via heat exchangers, and heat upgrade via heat pump integration.
Explore emergent behaviour, trade-offs, and interdisciplinary constraints.
Navigate system uncertainties by simulation data analysis and scenario thinking.
Understand the principles of heat integration using pinch analysis, heat exchanger networks, and heat pump systems, framed within complex industrial systems with interdependent subsystems.
Evaluate decarbonisation strategies and their performances in terms of energy savings, CAPEX/OPEX, carbon reduction, and operational risks, highlighting system-level trade-offs and nonlinear effects
Develop data-driven decision-making, navigating assumptions, parameter sensitivity, and model limitations, reflecting uncertainty and systems adaptation.
Explore ethical, sustainability, and resilience dimensions of engineering design, recognising how small changes or policy shifts may act on leverage points and produce emergent behaviours.
Analyse stakeholder dynamics, policy impacts, and uncertainty as part of the broader system environment influencing energy transition pathways.
Construct and interpret causal loop diagrams (CLDs), explore what-if scenarios, and apply multi-criteria decision analysis (MCDA), building competencies in feedback loops, system boundaries, and systems mapping.
Teachers have the opportunity to:
Embed systems thinking and complex systems pedagogy into energy and process engineering, using real-world simulations and data-rich problem-solving.
Introduce modelling and scenario-based reasoning, helping students understand how interactions between process units, energy streams, and external factors affect industrial decarbonisation.
Facilitate exploration of design trade-offs, encouraging learners to consider technical feasibility, economic sustainability, and environmental constraints within dynamic system contexts.
Support students in identifying leverage points, feedback loops, and emergent behaviours, using tools like CLDs, composite curves, and stakeholder role play.
Assess complex problem-solving capacity, including students’ ability to model, critique and adapt industrial systems under conflicting constraints and uncertain futures.
Proprietary Simulator for Pinch Analysis & Heat Integration. Freely available for educational use and can be accessed online through a secure link provided by the author on request (james.atuonwu@nmite.ac.uk or james.atuonwu@gmail.com). No installation or special setup is required; users can access it directly in a web browser.
About the simulation tool (access and alternatives):
This activity uses a Streamlit-based simulation tool, supported with process data (Appendix A, Table 1, or an educator’s equivalent). The tool is freely available for educational use and can be accessed online through a secure link provided by the author on request (james.atuonwu@nmite.ac.uk or james.atuonwu@gmail.com). No installation or special setup is required; users can access it directly in a web browser.The activity can also be replicated using open-source or online pinch analysis tools such as OpenPinch, PyPinchPinCH, TLK-Energy Pinch Analysis Online. SankeyMATIC can be used for visualising energy balances and Sankey diagrams.
Pinch Analysis, a systematic method for identifying heat recovery opportunities by analysing process energy flows, forms the backbone of the simulation. A brief explainer and further reading are provided in the resources section. Learners are assumed to have prior or guided exposure to its core principles. A key tunable parameter in Pinch Analysis, ΔTmin, represents the minimum temperature difference allowed between hot and cold process streams. It determines the required heat exchanger area, associated capital cost, controllability, and overall system performance. The teaching activity helps students explore these relationships dynamically through guided variation of ΔTmin in simulation, reflection, and trade-off analysis, as outlined below.
Introducing and prioritising ΔTmin trade-offs:
ΔTmin is introduced early in the activity as a critical decision variable that balances heat recovery potential against capital cost, controllability, and safety. Students are guided to vary ΔTmin within the simulation tool to observe how small parameter shifts affect utility demands, exchanger area, and overall system efficiency. This provides immediate visual feedback through the composite and grand composite curves, helping them connect technical choices to system performance.
Educators facilitate short debriefs using the discussion prompts in Part 1 and simulation-based sensitivity analysis in Part 2. Students compare low and high ΔTmin scenarios, reasoning about implications for process economics, operability, and energy resilience.
This experiential sequence allows learners to prioritise competing factors (technical, economic, and operational), while recognising that small changes can create non-linear, system-wide effects. It reinforces complex systems principles such as feedback loops and leverage points that govern industrial energy behaviour.
Data for decisions:
The simulator’s sidebar includes some default values for energy prices (e.g. gas and electricity tariffs) and emission factors (e.g. grid carbon intensity), which users can edit to reflect their own local or regional conditions. For those replicating the activity with other software tools, equivalent calculations of total energy costs, carbon emissions and all savings due to heat recovery investments can be performed manually using locally relevant tariffs and emission factors.
The Part 1–3 tasks, prompts, and assessment suggestions below remain fully valid regardless of the chosen platform, ensuring flexibility and accessibility across different teaching contexts.
Educator support and implementation notes:
The activity is designed to be delivered across 3 sessions (6–7.5 hours total), with flexibility to adapt based on depth of exploration, simulation familiarity, or group size. Each part can be run as a standalone module or integrated sequentially in a capstone-style format.
Part 1: System mapping: (Time: 2 to 2.5 hours) – Ideal for a classroom session with blended instruction and group collaboration:
This stage introduces students to the foundational step of any heat integration analysis: system mapping. The aim is to identify and represent energy-carrying streams in a process plant, laying the groundwork for further system analysis. Educators may use the Process Flow Diagram of Fig. 1, Appendix A (from a real industrial setting: a food processing plant) or another Process Diagram, real or fictional. Students shall extract and identify thermal energy streams (hot/cold) within the system boundary and map energy balances before engaging with software to produce required simulation outputs.
Key activities and concepts include:
Defining system boundaries: Focus solely on thermal energy streams, ignoring non-thermal operations. The boundary is drawn from heat sources (hot streams) to heat sinks (cold streams).
Identifying hot and cold streams: Students classify process material streams based on whether they release or require heat. Each stream is defined by its inlet and target temperatures and its heat capacity flow rate (CP).
Building the stream table: Students compile a simple table of hot/cold streams (name, supply temperature, target temperature and heat capacity flow CP).
Constructing energy balances and Sankey Diagrams: Students manually calculate energy balances across each subsystem in the defined system boundary, identifying energy inputs, useful heat recovery, and losses. Using this information, they construct Sankey diagrams to visualise the magnitude and direction of energy flows, strengthening their grasp of system-wide energy performance before optimisation.
Pinch Concept introduction: Students are introduced to the concept of “the Pinch”, including the minimum heat exchanger temperature difference (ΔTmin) and how it affects heat recovery targets (QREC), as well as overall heating and cooling utility demands (QHU & QCU, respectively).
Assumptions: All analysis is conducted under steady-state conditions with constant CP and no heat losses.
Discussion prompts:
What insights does the Sankey diagram reveal about energy use, waste and recovery potential in the system? How might these visual insights shape optimisation decisions?
Why might certain streams be excluded from the analysis?
How does the choice of ΔTmin influence the heat recovery potential and cost?
What trade-offs are involved in system simplification during mapping?
How can assumptions (like steady-state vs. transient) impact integration outcomes?
Student deliverables:
A labelled system map showing the thermal process boundaries, hot and cold streams.
A structured stream data table.
Justification for selected ΔTmin values based on process safety, economics, or practical design and operational considerations.
A basic Sankey diagram representing the energy flows in the mapped system, based on calculated heat duties of each stream.
Part 2: Running and interpreting process system simulation results (Time: 2 to 2.5 hours) – Suitable for lab or flipped delivery;only standard computer access is needed to run the tool (optional instructor demo can extend depth):
Students use the simulation tool to generate their own results.The process scenario of Fig. 1, Appendix A, with the associated stream data (Table 1) can be used as a baseline.
Tool-generated outputs:
Curves: Composite and Grand Composite (pinch location, recovery potential).
Scenario summary: QREC, QHU, QCU; COP (where applicable); CAPEX/OPEX/CO₂; payback period for various values of system levers (e.g., ΔTmin levels, tariffs, emission factors).
Heat Pump (HP) tables: Feasible pairs, Top-N heat pump selections (where N = 0, 1, or 2); QEVAP, QCOND, QCOMP, COP. All notations are designated in the simulator’s help/README section.
Learning tasks:
1. Scenario sweeps Run different scenarios (e.g., different ΔTmin levels, tariffs, emission factors, and Top-N HP selections). Prompts: How do QREC, QHU/QCU, HX area, and CAPEX/OPEX/CO₂ shift across scenarios? Which lever moves the needle most?
2. Group contrast (cases A vs B: see time-phased operations A & B in Appendix A) Assign groups different cases; each reports system behaviours and trade-offs. Prompts: Where do you see CAPEX vs. energy-recovery tension? Which case is more HP-friendly and why?
3. Curve reading Use the Composite & Grand Composite Curves to identify pinch points and bottlenecks; link features on the curves to the tabulated results. Prompts: Where is the pinch? How does ΔTmin change the heat-recovery target and utility demands?
4. Downstream implications Trace how curve-level insights show up in HX sizing/costs and HP options. Prompts: When does adding HP reduce utilities vs. just shifting costs? Where do stream temperatures/CP constrain integration?
5. Systems lens: feedback and leverage Map short causal chains from the results (e.g., tariffs → HP use → electricity cost → OPEX; grid-carbon → HP emissions → net CO₂). Prompts: Which levers (ΔTmin, tariffs, EFs, Top-N) create reinforcing or balancing effects?
Outcome:
Students will be able to generate and interpret industrial simulation outputs, linking technical findings to economic and emissions consequences through a systems-thinking lens. They begin by tracing simple cause–effect chains from the simulation data and progressively translate these into causal loop diagrams (CLDs) that visualise reinforcing and balancing feedback. Through this, learners develop the ability to explain how system structure drives performance both within the plant and across its broader industrial and policy environment.
Optional extension: Educators may provide 2–3 predefined subsystem options (e.g., low-CAPEX HX network, high-COP HP integration, hybrid retrofit) for comparison. Students can use a decision matrix to justify their chosen configuration against CAPEX, OPEX, emissions, and controllability trade-offs.
Part 3: Systems thinking through scenario analysis (Time: 2 to 2.5 hours) – Benefits from larger-group facilitation, a whiteboard or Miro board (optional), and open discussion. It is rich in systems pedagogy:
Having completed simulation-based pinch analysis and heat recovery planning, learners now shift focus to strategic implementation challenges faced in real-world industrial settings. In this part, students apply systems thinking to explore the broader implications of their heat integration simulation output scenarios, moving beyond process optimisation to consider real-world dynamics, trade-offs, and stakeholder interactions. The goal is to encourage students to interrogate the interconnectedness of decisions, feedback loops, and unintended consequences in process energy systems including but not limited to operational complexity, resilience to disruptions, and alignment with long-term sustainability goals.
Activity: Stakeholder role play / Multi-Criteria Decision Analysis Students take on stakeholder roles and debate which design variant or operating strategy should be prioritised. They then conduct a Multi-Criteria Decision Analysis (MCDA), evaluating each option based on criteria such as CAPEX, OPEX savings, emissions reductions, risk, and operational ease.
Stakeholders include:
Operations managers, focused on ease of control and process stability.
Investors and finance teams, focused on return on investment.
Environmental officers, concerned with emissions and policy compliance.
Engineers, responsible for design and retrofitting.
Community members, advocating for sustainable industry practices.
Government reps responsible for regulations and policy formulation, e.g. taxes and subsides.
The team must present a strategic analysis showing how the heat recovery system behaves as a complex adaptive system, and how its implementation can be optimised to balance technical, financial, environmental, and human considerations.
Optional STOP for questions and activities:
Before constructing causal loop diagrams (CLDs), learners revisit key results from their simulation — such as ΔTmin, tariffs, emission factors, and system costs — and trace how these parameters interact to influence overall system performance. Educators guide this transition, helping students abstract quantitative outputs (e.g., changes in QREC, OPEX, or CO₂) into qualitative feedback relationships that reveal cause-and-effect chains. This scaffolding helps bridge the gap between process simulation and systems-thinking representation, supporting discovery of reinforcing and balancing feedback structures.
Activity: Construct a causal loop diagram (CLD) Students identify at least five variables that interact dynamically in the implementation of a heat integration system (e.g. energy cost, investment risk, emissions savings, system complexity, staff training). They must map reinforcing and balancing feedback loops that illustrate trade-offs or virtuous cycles.
Where could policy or process changes trigger leverage points?
How could delays in response (e.g. slow staff adaptation to new technologies) affect outcomes?
How might design choices affect local energy equity, air quality, or community outcomes?
What policy incentives or ethical trade-offs might reinforce or hinder your proposed solution?
Instructor debrief (engineering context with simulation linkage): After students share their CLDs, the educator facilitates a short discussion linking their identified reinforcing and balancing loops to common dynamic patterns observable in the simulation results. For instance:
Limits to growth: As ΔTmin decreases, heat recovery (QREC) initially improves, but exchanger area, CAPEX, and controllability demands grow disproportionately — diminishing overall economic benefit.
Shifting the burden: Installing a heat pump may appear to improve carbon performance, but if low process efficiency remains unaddressed, electricity use and OPEX rise — creating a new dependency that shifts rather than solves the problem.
Tragedy of the commons: Competing units or stakeholders optimising locally (e.g. for their own OPEX or production uptime) can undermine total system efficiency or resilience.
Success to the successful: Design options with early financial or policy support (e.g. high-COP heat pumps) attract more investment and attention, reinforcing a positive but unequal feedback loop.
This reflection connects quantitative model outputs (e.g. QREC, OPEX, CAPEX, emissions) to qualitative system behaviours, helping learners recognise leverage points and understand how design choices interact across technical, economic, and social dimensions of decarbonisation.
Activity: Explore “What if?” scenarios
Working in groups, students choose one scenario to explore using a systems lens:
What if gas prices fluctuate drastically?
What if capital funding is delayed by 6 months?
What if a heat exchanger fouls during peak season?
What if CO₂ emissions policy tightens?
What if current electricity grid decarbonisation trends suffer an unexpected setback?
What if government policies now encourage onsite renewable electricity generation?
Each group evaluates the resilience and flexibility of the proposed integration design. They consider:
System bottlenecks and fragilities.
Leverage points for intervention.
Need for redundancy or modular design.
Educators may add advanced scenarios (e.g. carbon tax introduction, supplier failure, or project delay) to challenge students’ resilience modelling and stakeholder negotiation skills.
Stakeholder impact reflection:
To extend systems reasoning beyond the technical domain, students assess how their chosen design scenarios (e.g., low vs. high ΔTmin, with or without heat pump integration) affect each stakeholder group. For instance:
Operations managers assess control complexity, downtime risk, and maintenance implications.
Finance teams evaluate CAPEX/OPEX trade-offs and payback periods.
Environmental officers examine lifecycle emissions and regulatory compliance.
Engineers reflect on reliability, retrofit feasibility, and process safety.
Community members or regulators consider social and policy outcomes, such as visible sustainability impact or energy equity.
Each team member rates perceived benefits, risks, or compromises under each design case, and the results are summarised in a stakeholder impact matrix or discussion table. This exercise links quantitative system metrics (energy recovery, emissions, cost) to qualitative stakeholder outcomes, reinforcing the “multi-layered feedback” perspective central to complex systems analysis.
Learning Outcomes (Part 3):
By the end of this part, students will be able to:
Identify systemic interdependencies in industrial energy systems.
Analyse how feedback loops and delays influence system behaviour.
Assess the resilience of energy integration solutions under different future scenarios.
Balance multiple stakeholder objectives in complex engineering contexts.
Apply systems thinking tools to communicate complex technical scenarios to diverse stakeholder audiences.
Use systems diagrams and decision tools to support strategic analysis.
Instructor Note – Guiding CLD and archetype exploration:
Moving from numerical heat-exchange and cost data to CLD archetypes can be conceptually challenging. Instructors are encouraged to model this process by identifying at least one reinforcing loop (e.g. “energy savings → lower OPEX → more investment in recovery → further savings”) and one balancing loop (e.g. “higher capital cost → reduced investment → lower heat recovery”). Relating these loops to common system archetypes such as “Limits to Growth” or “Balancing with Delay” helps students connect engineering data to broader system dynamics and locate potential leverage points. The activity concludes with students synthesising their findings from simulation, systems mapping, and stakeholder analysis into a coherent reflection on complex system behaviour and sustainable design trade-offs.
Assessment guidance:
This assessment builds directly on the simulation and systems-thinking activities completed by students. Learners generate and interpret their own simulation outputs (or equivalent open-source pinch analysis results), using these to justify engineering and strategic decisions under uncertainty.
Assessment focuses on students’ ability to integrate quantitative analysis (energy, cost, carbon) with qualitative reasoning (feedbacks, trade-offs, stakeholder dynamics), demonstrating holistic systems understanding.
Deliverables (portfolio; individual or group):
1. Reading and interpretation of simulation outputs
Use the outputs you generate (composite & grand composite curves: HX match/area/cost tables; HP pairing/ranking; summary sheets of QHU, QCU, QREC, COP, CAPEX, OPEX, CO₂, paybacks) for a different industrial process (from the one used in the main learning activity) to:
Identify the pinch point(s) and explain what the curves imply for recovery potential and bottlenecks.
Comment on QHU/QCU/QREC and how they change across the scenarios you run (e.g., ΔTmin, tariffs, emission factors, Top-N HP selection).
Interpret trade-offs among energy, CAPEX, OPEX, emissions, using numbers reported by the simulator. No calculations beyond light arithmetic/annotation.
2. Systems mapping and scenario reasoning
A concise system boundary sketch and a simple stream table.
A Causal Loop Diagram (CLD) highlighting key feedbacks (e.g., tariffs ↔ HP use ↔ grid carbon intensity ↔ emissions/cost).
A short MCDA (transparent criteria/weights) comparing the scenario variants you test; include a brief stakeholder reflection.
3. Decision memo (max 2 pages)
Your recommended integration option under stated assumptions, with one “what-if” sensitivity (e.g., +20% electricity price, tighter CO₂ factor).
State uncertainties/assumptions and any implementation risks (operations, fouling, timing of capital).
Students should include a short reflective note addressing assumptions, feedback insights, and how their stakeholder perspective shaped their recommendation.
Appendix A: Example process scenario for teaching activity:
Sample narrative: Large-scale food processing plant with time-sliced operations
The following process scenario explains the industrial context behind the main teaching activity simulations. A large-scale food processing plant operates a milk product manufacturing line. The process, part of which is shown in Fig. 1, involves the following:
Thermal evaporation of milk feed.
Cooking operations after other ingredient mixing and formulation upstream.
Oven heating to drive off moisture and stimulate critical product attributes.
Pre-finishing operations as the product approaches packaging.
In real operations, the evaporation subprocessoccurs at different times from the cooking/separation, oven and pre-finishing operations. This means that their hot and cold process streams are not simultaneously available for direct heat exchange. For a realistic industrial pinch analysis, the process is thus split into two time slices:
Time Slice A (used for scenario Case A): Evaporation streams only.
Time Slice B (Case B): Cooking/separation, oven and pre-finishing streams only.
Separate pinch analyses are performed for each slice, using the yellow-highlighted sections of Table 1 as stream data for time slice A, and the green-highlighted sections as stream data for time slice B. Any heat recovery between slices would require thermal storage (e.g., a hot-water tank) to bridge the time gap.
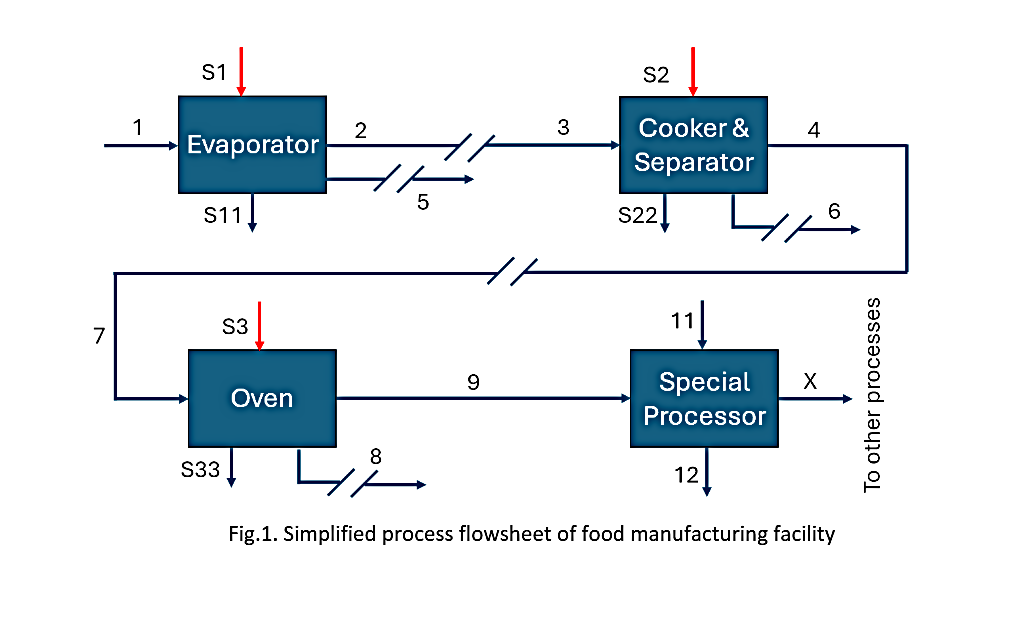
Fig.1. Simplified process flowsheet of food manufacturing facility.
Note on storage and system boundaries:
Because the two sub-processes occur at different times, direct process-to-process heat exchange between their streams is not possible without thermal storage. If storage is introduced:
Production surplus heat at time slice A can be stored at high temperature (e.g., 80 °C) and later discharged to preheat time slice B cold streams.
The size of the tank depends on the portion of hot utility demand of sub-process B to be offset, the temperature swing, and the duration of the sub-process B.
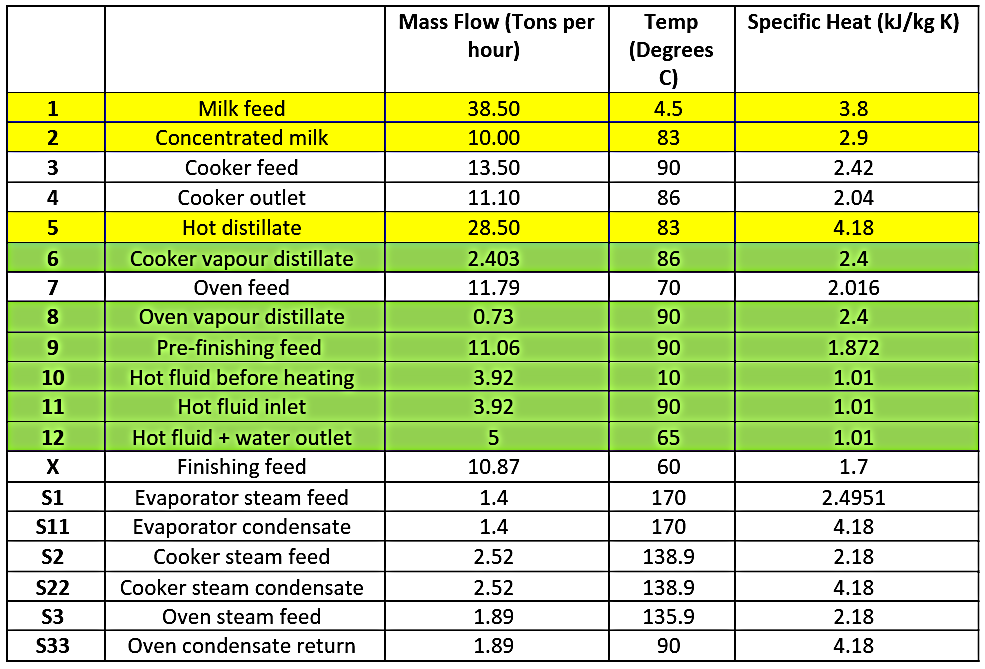
Table 1. Process stream data corresponding to flowsheet of Fig. 1. Yellow-highlighted sections represent processes available at time slice A, while green-highlighted sections are processes available at time slice B.
Appendix B: Suggested marking rubric (Editable):
Adopter note: The rubric below is a suggested template. Instructors may adjust criteria language, weightings and band thresholds to align with local policies and learning outcomes. No marks depend on running software.
1) Interpretation of Simulation Outputs — 25%
A (Excellent): Reads curves/tables correctly; uses QHU/QCU/QREC, COP, CAPEX/OPEX/CO₂, payback figures accurately; draws clear, defensible trade-offs.
B (Good): Mostly accurate; links numbers to decisions with some insight.
C (Adequate): Mixed accuracy; limited or generic trade-off discussion.
D/F (Weak): Frequent misreads; cherry-picks or contradicts generated data.
2) Systems Thinking & Scenario Analysis — 30%
A: Clear CLD with at least one reinforcing and one balancing loop; leverage points identified; scenarios coherent; MCDA with explicit criteria, weights, and justified ranking; uncertainty acknowledged.
B: Reasonable CLD; scenarios sound; MCDA present with partial justification.
C: Superficial CLD; scenarios/MCDA incomplete or weakly reasoned.
D/F: Little or no systems view; scenarios/MCDA absent or not meaningful.
Atuonwu, J.C. (2025). A Simulation Tool for Pinch Analysis and Heat Exchanger/Heat Pump Integration in Industrial Processes: Development and Application in Challenge-based Learning. Education for Chemical Engineers 52, 141-150.
Oh, X.B., Rozali, N.E.M., Liew, P.Y., Klemes, J.J. (2021). Design of integrated energy- water systems using Pinch Analysis: a nexus study of energy-water-carbon emissions. Journal of Cleaner Production 322, 129092.
Rosenow, J., Arpagaus, C., Lechtenböhmer, S.,Oxenaar, S., Pusceddu, E. (2025). The heat is on: Policy solutions for industrial electrification. Energy Research & Social Science 127, 104227.
Bale, C.S.E., Varga, L., Foxon, T.J. (2015). Energy and complexity: New ways forward. Applied Energy 138, 150-159.
Atuonwu, J.C. (2025). Proprietary Simulator for Pinch Analysis & Heat Integration. Private reviewer access available on request (demo video or temporary login).
Any views, thoughts, and opinions expressed herein are solely that of the author(s) and do not necessarily reflect the views, opinions, policies, or position of the Engineering Professors’ Council or the Toolkit sponsors and supporters.
Related INCOSE Competencies: Toolkit resources are designed to be applicable to any engineering discipline, but educators might find it useful to understand their alignment to competencies outlined by the International Council on Systems Engineering (INCOSE). The INCOSE Competency Framework provides a set of 37 competencies for Systems Engineering within a tailorable framework that provides guidance for practitioners and stakeholders to identify knowledge, skills, abilities and behaviours crucial to Systems Engineering effectiveness. A free spreadsheet version of the framework can be downloaded.
This resource relates to the Systems Thinking, Requirements Definition, Communication, Design For, and Critical Thinking INCOSE Competencies.
AHEP4 mapping: This resource addresses several of the themes from the UK’s Accreditation of Higher Education Programmes fourth edition (AHEP4): Analytical Tools and Techniques (critical to the ability to model and solve problems), and Integrated / Systems Approach (essential to the solution of broadly-defined problems). In addition, this resource addresses the themes of Sustainability and Communication.
Educational level: Beginner; intermediate.
Acknowledgement:
The case study underpinning this teaching activity was developed by Prof. Kristen MacAskill (University of Cambridge). The Module was first developed and implemented in teaching by TEDI- London, led by a team of learning technologists, Ellie Bates, Laurence Chater, Pratishtha Poudel, and academic member, Rhythima Shinde. This work was carried out in collaboration with the Royal Academy of Engineering through its Engineering X programme — a global partnership that supports safer, more sustainable engineering education and practice worldwide. With critical support from Professor Kristen MacAskill and involvement of Ana Andrade and Hazel Ingham, Aisha Seif Salim. This was a collective effort involving many individuals across TEDI-London and RAEng (advisors and reviewers), and while we cannot name everyone here, we are deeply grateful for all the contributions that made this module possible.
Learning and teaching notes:
This case study introduces a structured, systems-thinking–based teaching resource. It provides educators with tools and frameworks—such as the Cynefin framework and stakeholder mapping—to analyse and interpret complex socio-technical challenges. By exploring the case of the Queensland, Australia floods, it demonstrates how engineering decisions evolve within interconnected technical and social systems, helping students link theory with practice.
The Cynefin framework (Nachbagauer, 2021; Snowden, 2002), helps decision-makers distinguish between different types of problem contexts—simple, complicated, complex, chaotic, and disordered. In an engineering context, this framework guides learners to recognise when traditional linear methods work (for simple or complicated problems) and when adaptive, experimental approaches are required (for complex or chaotic systems).
Within this teaching activity, Cynefin is used to help students understand how resilience strategies evolve when facing uncertainty, incomplete information, and changing stakeholder dynamics. By mapping case study events to the Cynefin domains, learners gain a structured way to navigate uncertainty and identify appropriate modes of action.
This case study activity assumes basic familiarity with systems concepts and builds on this foundation with deeper application to real-world socio-technical challenges.
Summary of context:
The activity focuses on a case study of 2010–2011 floods in Queensland, Australia, which caused extensive damage to urban infrastructure. The Queensland Reconstruction Authority (QRA) initially directed resources to short-term asset repairs but subsequently shifted towards long-term resilience planning, hazard management, and community-centred approaches.
The case resonates with global engineering challenges, such as flood, fire, and storm resilience, and can be easily adapted to local contexts. This case therefore connects systems thinking theory directly to engineering and governance decisions, illustrating how frameworks like Cynefin can support engineers in navigating uncertainty across technical and institutional domains.
Learning objectives:
Aligned with AHEP4 (Engineering Council, 2020) – Outcomes 6, 10, and 16 on systems approaches, sustainability, and risk – this activity emphasises systems thinking, stakeholder engagement, problem definition, and decision-making under uncertainty.
This teaching activity introduces learners to the principles and practice of systems thinking by embedding a real-world case study into engineering education (Godfrey et al., 2014; Monat et al.,2022). The objectives are to:
Enable students to recognise interconnections, interdependencies, and evolving behaviours of stakeholders within socio-technical systems.
Support learners in applying systems frameworks —particularly the Cynefin framework and stakeholder mapping—to analyse complexity, uncertainty, and decision-making in climate resilience and disaster mitigation contexts.
Apply systems thinking tools and frameworks to real-world challenges, such as climate resilience and disaster mitigation.
Strengthen confidence in addressing uncertainty and complexity in engineering problem-solving.
Collaborate effectively across diverse teams, appreciating multiple stakeholder perspectives.
Reflect critically on trade-offs and decision-making in engineering practice.
Equip students to transfer systems insights from case-based scenarios to broader projects in their curriculum and future professional practice.
Teachers have the opportunity to:
Introduce students to complex systems concepts through engaging, real-world case studies.
Facilitate interactive, blended learning using narrative-driven tools, explainer animations, and role-play exercises.
Assess learners’ baseline and improved understanding of systems thinking through pre- and post-module surveys.
Guide students in navigating multiple systems frameworks while managing cognitive load.
Encourage interdisciplinary collaboration and stakeholder-focused analysis within classroom or project-based settings.
Adapt and scale the teaching activity for different educational levels, contexts, and case study themes (e.g., floods, wildfires, extreme heat).
This dedicated platform hosts the interactive modules designed for this teaching activity. Students progress through three modules — Context, Analysis and Insights, and Discussion and Transferable Learning. Each module includes animations, narrative-driven content, scenario prompts, and interactive tasks. The platform ensures flexibility: it can be used in fully online, hybrid, or face-to-face settings. All necessary digital assets (readings, maps, videos, and quizzes) are embedded, so learners have a “one-stop” environment.
The core teaching narrative is anchored in this Engineering X case study. It documents the evolution of the Queensland Reconstruction Authority (QRA) from a short-term flood recovery body to a long-term resilience institution. This resource provides students with authentic socio-technical detail — including stakeholder conflicts, institutional learning, and systemic barriers — which they then interrogate using systems thinking frameworks.
This resource provides a suggested delivery schedule for facilitators. It maps when live sessions, asynchronous tasks, and group discussions should occur, ensuring students remain engaged over the course. It also indicates where key reflective points and assessments (both formative and summative) can be integrated.
5. Pre- and post-module assessment form: (Appendix C)
This tool evaluates students’ systems thinking learning outcomes. It includes:
Baseline survey: assesses initial understanding of systems thinking, approaches to complex problems, and confidence in collaboration.
Scenario-based survey: applies systems thinking questions to a specific context (e.g. extreme monsoon rains and flooding in the case of Sakura Cove – as per the group assignment in module 1).
Post-module survey: measures changes in understanding, confidence, and skills, while also capturing qualitative reflections on learning.
The form provides both quantitative data (Likert scales) and qualitative insights (open-ended reflections), enabling robust evaluation of teaching impact.
Assessment:
Formative: Pre- and post-module surveys assess changes in learners’ self-reported understanding of systems thinking (Appendix A). Facilitators may adapt reflective prompts and scenario-based activities as part of coursework.
Summative (optional): Students can integrate insights into ongoing design projects (e.g. climate resilience in urban redevelopment), with assessment based on problem analysis, stakeholder engagement, and solution development.
Narrative of the case:
Learners are introduced to the case via a fictional guide, “Bernice,” who frames the scenario and supports navigation through the material. Students work through three stages that progressively apply the Cynefin framework and other systems tools to understand how resilience emerges through evolving governance and engineering responses:
1. Context module:
Initial Mandate: Students explore how the QRA was first tasked with rapid technical recovery—fixing roads after flood damage.
Narrative Depth: They study the Queensland floods of 2010–11 not just as a physical shock, but as a systemic stress test on multiple layers: infrastructure, governance, and community systems.
2. Analysis & insights module:
Framework Application: Learners apply systems frameworks (e.g., Cynefin, stakeholder maps) to see how QRA’s remit expanded over time—from asset restoration to hazard anticipation and community resilience.
Knowledge Types: Students distinguish between explicit knowledge (e.g., rebuild standards, hydrology data) and tacit knowledge (e.g., local inter-agency trust, relational coordination).
Governance Layers: Activities explore how resilience depends on multi-level governance, local-state-federal coordination, and overcoming systemic barriers like funding cycles or short-lived institutional mandates.
3. Discussion & transfer learning module:
Reflective Debate: Students weigh whether engineering alone can deliver resilience, or whether social relationships and institutions are equally critical.
Barrier Identification: They debate typical constraints—political, funding, institutional—and propose ways systems thinking can mitigate them.
Transfer Lab: Learners apply the evolved QRA model to other scenarios—e.g., urban heat adaptation or wildfires—considering both technical measures and governance dynamics.
Interactive learning design:
The teaching activity integrates multiple interactive elements to immerse students in systems thinking:
Role-play simulations: Learners take on the role of Queensland Reconstruction Authority (QRA) decision-makers, negotiating trade-offs between immediate engineering fixes and long-term institutional resilience. This requires balancing technical priorities with building trust, relationships, and governance capacity.
Scenario challenges: Students are presented with governance disruptions (e.g. funding cuts, loss of stakeholder trust, leadership turnover). They must reframe solutions using systems approaches, moving from reactive technical patchworks towards adaptive, capacity-building strategies.
Interactive digital tools: The online platform provides hotspot maps for exploring interdependencies, drag-and-drop activities for categorising frameworks, explainer animations, and AI-driven chatbot negotiations with sceptical stakeholders. These exercises develop critical and applied problem-solving skills.
Collaborative reflection: Group discussions and peer-to-peer feedback allow learners to surface diverse perspectives, debate trade-offs, and integrate insights into ongoing project briefs.
Why this approach adds value:
Although rooted in social-technical interactions, the activity explicitly connects systems thinking to core engineering design competencies—problem framing, stakeholder analysis, and iterative solution development under uncertainty
Holistic understanding of resilience: Students experience resilience as more than just technical recovery. They engage with a dynamic system that includes knowledge creation, governance evolution, and social relationships.
Adaptive systems thinking in action: The evolving narrative demonstrates how system boundaries shift over time, and how sustainable outcomes require not only engineering but institutional and cultural change.
Direct relevance to real-world engineering: The case mirrors global infrastructure challenges where effective disaster response and resilience planning depend on the interplay between technical solutions, governance capacity, and community engagement.
Guided questions and activities:
Facilitators can use these prompts to stimulate inquiry and structured reflection:
Who are the key stakeholders in the QRA flood response, and where do their priorities align or conflict?
How do feedback loops and interdependencies influence resilience planning?
What trade-offs exist between rapid repair and long-term resilience?
How can systems frameworks such as the Cynefin model or stakeholder mapping guide decision-making under uncertainty?
In role-play: how would you convince a sceptical funder (AI chatbot) to invest in resilience measures?
How could lessons from flood mitigation be applied to other contexts such as wildfire or urban heat resilience?
Opportunities for extension:
In addition to the Queensland floods and Sakura Cove examples, educators may draw parallels with urban heat planning in London, wildfire adaptation in Australia, or storm resilience in the Netherlands. These comparative cases allow learners to generalise systems insights beyond one event or geography.
The activity is designed to be scalable and adaptable:
Broader case study base: Educators can expand beyond flood resilience to include wildfire, storm, or extreme heat events.
Integration with larger modules: The activity can be embedded into project-based learning modules (e.g. urban redevelopment, transport network resilience).
Advanced complexity: For higher-level learners, facilitators can introduce additional frameworks (e.g. agent-based modelling, system dynamics) to deepen analysis.
This flexibility allows educators to tailor the activity to their students’ level of expertise, institutional context, and disciplinary focus.
References:
Design Council. (2021). Beyond Net Zero: A systemic design approach. Design Council.
Godfrey, P., Crick, R. D., & Huang, S. (2014). Systems thinking, systems design and learning power in engineering education. International Journal of Engineering Education.
Monat, J., Gannon, T., & Amissah, M. (2022). The case for systems thinking in undergraduate engineering education. International Journal of Engineering Pedagogy, 12(3), 50–88.
Nachbagauer, A. (2021). Managing complexity in projects: Extending the Cynefin framework. Project Leadership and Society, 2, 100017.
Snowden, D. (2002). Complex acts of knowing: paradox and descriptive self‐awareness. Journal of knowledge management, 6(2), 100-111.
Any views, thoughts, and opinions expressed herein are solely that of the author(s) and do not necessarily reflect the views, opinions, policies, or position of the Engineering Professors’ Council or the Toolkit sponsors and supporters.
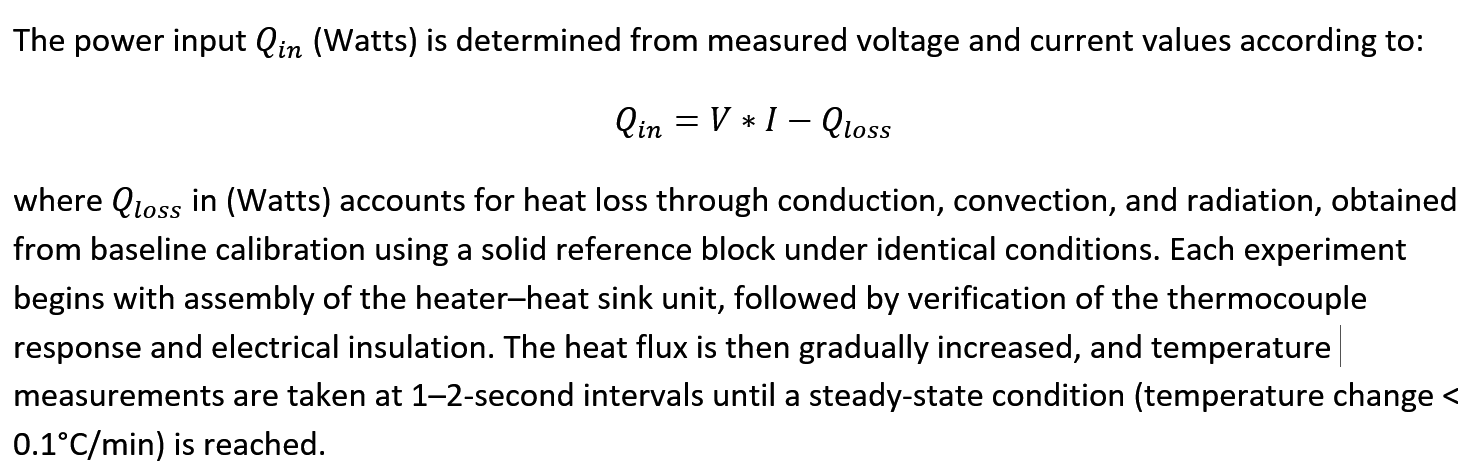
Keywords: Artificial Intelligence; Large Language Model; Sociotechnical systems; Ethics; Modelling or simulation; Emergence.
Licensing:This work is licensed under a Creative Commons Attribution-ShareAlike 4.0 International License. It is based upon the author’s article “Enhancing Ethical Reasoning in Engineering Education through Student-Created Interactive Ethical Scenarios Using Generative AI,” 2025 IEEE Global Engineering Education Conference (EDUCON), London, United Kingdom, 2025, pp. 1-5, doi: 10.1109/EDUCON62633.2025.11016531.
Related INCOSE Competencies: Toolkit resources are designed to be applicable to any engineering discipline, but educators might find it useful to understand their alignment to competencies outlined by the International Council on Systems Engineering (INCOSE). The INCOSE Competency Framework provides a set of 37 competencies for Systems Engineering within a tailorable framework that provides guidance for practitioners and stakeholders to identify knowledge, skills, abilities and behaviours crucial to Systems Engineering effectiveness. A free spreadsheet version of the framework can be downloaded.
This resource relates to the Systems Thinking, Life Cycle, Configuration Management, Requirements Definition, Verification, and Validation INCOSE Competencies.
AHEP mapping: This resource addresses several of the themes from the UK’s Accreditation of Higher Education Programmes fourth edition (AHEP4): Analytical Tools and Techniques (critical to the ability to model and solve problems), and Integrated / Systems Approach (essential to the solution of broadly-defined problems). In addition, this resource addresses AHEP themes of Ethics and Communication.
Debug their simulation through playtesting, documenting issue → fix → retest cycles and demonstrating how changes improve coherence.
Explore trade-offs and justify decisions in ethics (e.g. consequences and equity) and complex systems (e.g. resilience vs cost vs emissions).
Evidence learning with transparent artefacts: initial prompt, changes via tracked changes or before/after snippets, tester feedback, and final prompt.
Reflect critically on validity, bias and the limitations of LLMs as simulators, including how to handle unsafe/poor choices by surfacing realistic consequences.
Communicate findings clearly to technical and nontechnical audiences.
Teachers have the opportunity to:
Use this as either a studio activity (3–5 sessions) or a compact assessment only task (1–2 sessions), with clear rubrics for each.
Standardise scope by offering a predefined scenario (e.g., Urban Heatwave Response, UK city), or permit student proposed topics.
Scale marking via artefact based evidence (prompt, change log, feedback, final prompt) rather than long reports.
Deliver with institutional Microsoft Copilot licences or any free web LLM; require students to disclose model and version used.
Adapt quickly to different disciplines by swapping the scenario pack (microgrids, water networks, medical device supply chains, etc.).
Overview:
This resource enables engineering students to create, run, and debug a text‑based, interactive simulation of a complex sociotechnical system using a Large Language Model (LLM). It is intentionally flexible and may be delivered as a multi‑session studio activity (including assessment) or used solely as a compact assessment.
Purpose and use:
In both modes, students design a robust text prompt, test it with a user, document changes, and submit auditable artefacts that evidence learning. The key activity is interrogating their own thinking on how complex systems should be modelled by making judgements as to how their game does and does not capture the system dynamics.
The submission is a text LLM prompt with tracked changes, which allows students to demonstrate system design and debugging, produce transparent process evidence, and scale to large cohorts with minimal infrastructure.
Delivery options at a glance:
Audience
Undergraduate Years 2–4 and taught MSc, any engineering discipline
Modes
Studio activity (3–5×2 h + independent study) or Assessment‑only (prompt‑only; 1–2×2 h + 4–6 h)
Teams
3–4 students (solo permitted for assessment‑only)
Assessment
Portfolio (studio) or prompt‑plus‑change‑log (assessment‑only)
Platforms
Institutional Copilot licences successful; encourage exploration of free tools (students record model/version)
Materials and software:
LLM access: institutional Microsoft Copilot licences (proven) or any reputable free web‑based tool. Students disclose the model and version.
Delivery modes:
Mode A — Studio activity (3–5 sessions)
Session 1: Frame the system — boundary, stakeholders, conflicting goals; sketch a Causal Loop Diagram (CLD) with at least two reinforcing and two balancing loops.
Session 2: Make it playable — define 4–8 state variables and KPIs; draft the prompt (based on Appendix A); specify commands, turn length and stop conditions; add debug controls (`trace`, `why`, `show variables`, `revert`).
Between sessions: Prototype v1 — run 10–15 turns; capture a transcript; log defects (e.g. inconsistent updates, missing delays, moralising responses).
Session 3: Play‑test and iterate — exchange prototypes across teams or test with an external user; record issue → fix → re‑test cycles with evidence (make sure edits are captured in tracked changes).
Session 4: Present and reflect — short demo (6–8 turns); explain how feedback/delays manifest; discuss surprises and limits.
Mode B — Assessment‑only (prompt‑only; 1–2 sessions)
Session 1: Brief and rapid scoping — select a scenario (student‑chosen or predefined); write a one‑paragraph boundary and stakeholders note; draft the initial prompt (based on Appendix A) with role choices, 4–6 state variables, simple commands, and a 12–15 turn cap.
Independent work: Debugging loop — run the prompt; identify faults; edit the prompt (make sure edits are captured in tracked changes); re‑run and capture short snippets demonstrating fixes; test with one peer and collect written feedback.
Session 2: Submission — students submit a single document with the initial prompt, change log (before/after snippets), tester feedback, the final prompt, and a short rationale of innovative choices.
In both modes, module leaders may supply a predefined scenario(s) to standardise scope and simplify marking. A ready‑to‑use example is provided in Appendix C.
Critical medical device supply chain — redundancy vs cost; equitable allocation.
Appendix A — Prompt template (simulation + debug‑ready):
Title: Complex Systems Simulator — [Scenario]
Purpose: Run a turn‑based interactive simulation of a complex sociotechnical system. Track named state variables, apply feedback and delays, and let the player’s decisions drive non‑linear outcomes.
Setup:
1) Offer three roles (distinct authority/constraints).
2) Introduce 3–5 NPCs with clear goals and plausible interventions.
3) Show a dashboard of [STATE_VARIABLES] each turn with short context.
State rules:
Track only these variables (with units/ranges): [list 5–8].
Maintain at least two feedback loops and one delay; keep hidden rule notes consistent across turns.
Each turn: recap; propose 3–5 options (plus free‑text); explain updates; show dashboard; request the following action.
Time step: 5 minutes to 1 week; end after 20–30 turns or on stop conditions.
Commands: status, talk [npc], inspect [asset], implement [policy], pilot [intervention], advance time, review log.
Debug commands (for testing): trace on/off (print update logic), why (state which loops/delays drove the change), show variables (print current state table), revert (roll back one turn), reseed (slight exogenous shock).
Realism and ethics: Allow all plausible actions and report consequences neutrally. If unsafe in the real world, refuse, propose safer alternatives, and continue with plausible systemic effects.
LLM pitfalls to avoid: Do not invent new variables; ask clarifying questions rather than guessing; keep outputs concise; summarise trajectory every five turns.
Begin: Greet the player, state the scenario, ask for a role, and wait.
Appendix B — Debugging and play‑test checklist:
Functional coherence
Do state variables update consistently with declared logic?
Are reinforcing and balancing feedback identifiable in play?
Robustness
Does the simulation permit negative choices with realistic consequences?
Do trace/why explanations match outcomes?
Are stop conditions respected?
User experience and clarity
Are commands clear? Is turn pacing appropriate?
Are dashboards concise and informative?
Report
Provide three concrete defects with turn numbers, the prompt edits that fixed them, and evidence of the re‑run.
Appendix C — Predefined scenario (Urban Heatwave Response, UK city):
Boundary: One UK local authority area during the July–August heatwave period. Focus on public health, energy demand, and community resilience.
Roles: (1) Local Authority Resilience Lead; (2) NHS Trust Capacity Manager; (3) Distribution Network Operator (DNO) Duty Engineer.
Stakeholders: Residents (with a focus on vulnerable groups), care homes, schools, SMEs, DNO, local NHS Trust, emergency services, voluntary/community groups, Met Office (for alerts), and local media.
State variables (examples): Heat‑health alert level (0–4); Emergency Department occupancy (%); Electricity demand/capacity (% of peak); Indoor temperature exceedance hours (hrs > 27 °C); Public trust (0–100); Budget (£); Equity index (0–100).
Events/shocks: Red heat alert; substation fault; procurement delay; misinformation spike on social media; transport disruption; community centre cooling failure.
KPIs and stop conditions: Heat‑related admissions; unserved energy; cost variance; equity gap across wards. Stop if alert level 4 persists >3 days, budget overspends >10%, or trust <25.
Notes for assessors: Using a standard, predefined scenario simplifies marking and ensures comparable complexity across teams, while still allowing for diverse strategies and outcomes.
Any views, thoughts, and opinions expressed herein are solely that of the author(s) and do not necessarily reflect the views, opinions, policies, or position of the Engineering Professors’ Council or the Toolkit sponsors and supporters.
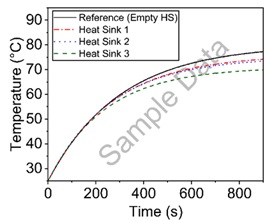
Related INCOSE Competencies: Toolkit resources are designed to be applicable to any engineering discipline, but educators might find it useful to understand their alignment to competencies outlined by the International Council on Systems Engineering (INCOSE). The INCOSE Competency Framework provides a set of 37 competencies for Systems Engineering within a tailorable framework that provides guidance for practitioners and stakeholders to identify knowledge, skills, abilities and behaviours crucial to Systems Engineering effectiveness. A free spreadsheet version of the framework can be downloaded.
This resource relates to the Systems Thinking, Systems Modelling and Analysis, Ethics and Professionalism, Technical Leadership and Critical Thinking INCOSE Competencies.
AHEP4 mapping: This resource addresses several of the themes from the UK’s Accreditation of Higher Education Programmes fourth edition (AHEP4): Analytical Tools and Techniques (critical to the ability to model and solve problems), and Integrated / Systems Approach (essential to the solution of broadly-defined problems). In addition, this resource addressesAHEP themes of Design, Ethics and Communication.
Educational level: Intermediate; Advanced.
Learning and teaching notes:
The case is built around 3 × 90-minute sessions and independent report writing. A suggested breakdown of the activities can be seen below.
Learners have the opportunity to:
Explore how technical, human, and organisational factors interact in complex socio-technical systems.
Apply Fault Tree Analysis (FTA) to diagnose ambiguous real-world engineering failures.
Practice making judgements under uncertainty with incomplete and conflicting data.
Analyse competing stakeholder perspectives and the ethical trade-offs in engineering decision-making.
Develop professional communication skills by producing expert reports and presenting findings to a stakeholder panel.
Reflect on their own reasoning, assumptions, and handling of complexity.
Teachers have the opportunity to:
Use an authentic, narrative-driven case to introduce systems thinking and failure analysis.
Facilitate active learning through group FTA construction and peer review.
Engage students in interdisciplinary learning that links materials science, engineering practice, regulation, and ethics.
Adapt the complexity of the case (technical vs organisational) depending on learners’ level and course focus.
Provide formative and summative assessment using expert reports, presentations, and reflective writing.
Encourage metacognitive development by prompting students to examine uncertainty and assumptions in engineering practice.
20 min: Introduce case scenario and system context; 30 min: Group discussion on initial impressions, key stakeholders, and potential causes; 40 min: Begin Fault Tree Analysis (FTA) construction using initial evidence.
2
Investigation and analysis
30 min: Continue FTA construction and data evaluation; 30 min: Peer review of other groups’ fault trees; 30 min: Consolidate findings and prepare draft report outline.
3
Reporting and reflection
30 min: Present findings to a simulated stakeholder panel; 30 min: Discuss feedback and defend conclusions; 30 min: Individual reflection on complexity, uncertainty, and assumptions.
Summary of the system or context:
Rail transport systems consist of thousands of interdependent components, including rails, fasteners, sleepers, signalling systems, and maintenance processes. Failures in a single component can cascade, affecting:
Safety: Malfunctions may cause derailments or delays.
Economics: Service interruptions lead to financial losses and reputational damage.
Public trust: Media scrutiny increases scrutiny of operational practices.
On a cold January morning, a commuter train was halted after inspectors discovered a fractured rail joint component. Services were disrupted for several hours, stranding thousands of passengers. The media quickly picked up the story, raising questions about safety and reliability.
The rail operator urgently commissioned an engineering consultancy (the students) to investigate the failure. Their findings will inform both the safety authority’s decision on whether the line can reopen and the legal proceedings to determine liability.
The dilemma:
The operator demands a rapid report to resume services.
The manufacturer insists the component was produced to specification and blames poor maintenance.
The regulator requires an unbiased, defensible technical opinion before approving operations.
The public expects transparency and reassurance about safety.
As consultants, students face incomplete evidence: some lab tests are missing, inspection logs are inconsistent, and eyewitness accounts conflict. They must use Fault Tree Analysis (FTA) to map possible causes, evaluate data, and produce an expert opinion report — knowing that their conclusions could influence legal outcomes and public safety decisions.
Groups: 3–5 students per group; 3-4 groups can run in parallel.
Materials required: case narrative handouts, sample inspection log, example FTA, whiteboards/flipcharts, sticky notes for FTA mapping.
Activity flow:
1. Introduce case and assign roles.
2. Construct initial fault trees using evidence.
3. Peer-review across groups.
4. Draft expert report and present to simulated stakeholder panel.
5. Individual reflection on complexity and uncertainty.
Why use Fault Tree Analysis (FTA):
FTA is a structured approach to trace a failure from an observed event back to potential causes, including technical, human, and organisational factors.
FTA is particularly suitable for this case because it allows students to structure complex, uncertain information in a logical and transparent way. It helps them trace the chain of causes behind the rail component failure, linking material, human, and organisational factors into one coherent framework. By visualising how small events combine into system-level failures, FTA encourages learners to think critically about interdependencies, data gaps, and assumptions. It also mirrors real-world engineering investigations, where professionals must justify conclusions under uncertainty and demonstrate clear reasoning to stakeholders such as regulators or courts.
Visualises cause-effect relationships, interdependencies, and failure paths.
Encourages discussion of assumptions and uncertainties.
Questions and activities:
Discussion prompts:
Prompt
Expected insight / reflection
What technical, human, and organisational factors might have contributed to this failure?
Students identify multiple interacting factors, illustrating interdependencies and emergent risks.
How does Fault Tree Analysis help structure uncertainty in this investigation?
Learners recognise FTA’s role in visualising cause-effect pathways and clarifying assumptions.
Which assumptions are you forced to make, and how might they affect your conclusions?
Students reflect on data gaps, biased observations, and ethical implications of assumptions.
How do different stakeholders’ interests shape urgency and framing of your analysis?
Learners understand trade-offs, pressures from conflicting priorities, and the precautionary principle.
What are the risks of issuing a preliminary report under time pressure?
Students explore implications for safety, liability, professional integrity, and public trust.
Classroomactivities:
Activity
Focus
What “good practice” looks like
Facilitator notes / tips
1. FTA construction
Collaborative problem analysis
Teams discuss evidence openly, question assumptions, and co-create a logical tree linking technical, human, and organisational causes.
Encourage each group to identify at least one “human/organisational” branch and to label any data gaps explicitly.
2. Peer review
Critical reflection and systems perspective
Groups provide constructive critique, highlighting hidden assumptions, missing branches, or unclear logic. Dialogue stays professional and evidence-based.
Provide coloured sticky notes or digital comments to record feedback; model how to frame critique as questions (“Have you considered…?”).
3. Report writing (in-class drafting)
Synthesis and professional communication
Drafts show a clear, defensible reasoning chain from evidence to conclusion. Teams justify assumptions and note uncertainties.
Remind students to separate “facts” from “interpretations.” Encourage use of structured headings (Findings – Analysis – Conclusions).
4. Simulation role-Play
Perspective-taking and communication under pressure
Presentations are concise (≤5 min), factual, and adapted to stakeholder roles. Learners respond respectfully and clearly to challenging questions.
Provide role cards for the panel (operator, regulator, manufacturer, public). Rotate students if possible.
5. Reflection
Metacognition and learning from uncertainty
Students identify what surprised them, what they found ambiguous, and how their view of engineering judgment evolved.
Offer prompts like “What would you do differently next time?” or “Where did your reasoning feel uncertain?”
Further challenge:
Instructors may choose to introduce a second “reveal” phase: a new metallurgical test result or a whistle-blower statement emerges halfway through the case. Students must revise their fault tree and defend whether and how their conclusions change. This highlights the evolving nature of complex systems investigations.
Assessment opportunities:
Fault Tree Diagram (30%) – accuracy, depth, clarity.
Presentation and defence (20%) – clarity, stakeholder awareness, handling questions.
Reflective summary (20%) – insight into uncertainty, assumptions, systems thinking.
Any views, thoughts, and opinions expressed herein are solely that of the author(s) and do not necessarily reflect the views, opinions, policies, or position of the Engineering Professors’ Council or the Toolkit sponsors and supporters.
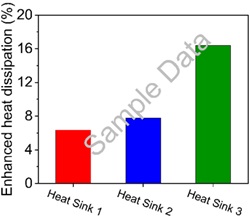
Activity: Assessment. This example demonstrates how the questions provided in Assessing ethics: Rubric can be used to assess the competencies stipulated at each level.
Authors: Dr. Natalie Wint (UCL); Dr. William Bennett (Swansea University).
This example demonstrates how the questions provided in the accompanying rubric can be used to assess the competencies stipulated at each level. Although we have focused on ‘Water Wars’ here, the suggested assessment questions have been designed in such a way that they can be used in conjunction with the case studies available within the toolkit, or with another case study that has been created (by yourself or elsewhere) to outline an ethical dilemma.
Year 1
Personal values: What is your initial position on the issue? Do you see anything wrong with how DSS are using water? Why, or why not?
Students should provide a stance, but more importantly their stance should be justified. In this instance this may involve reference to common moral values such as environmental sustainability, risk associated with power issues and questions of ownership.
Professional responsibilities: What ethical principles and codes of conduct are relevant to this situation?
Students should refer to relevant principles (e.g. from the Joint Statement of Ethical Principles). For example, in this case some of the relevant principles may include (but not be limited to) “protect, and where possible improve, the quality of built and natural environment”, “maximise the public good and minimise both actual and potential adverse effects for their own and succeeding generations” and “take due account of the limited availability of natural resources”.
Ethical principles and codes of conduct can be used to guide our actions during an ethical dilemma. How does the guidance provided in this case align/differ with your personal views? (This is a question we had created in addition to those provided within the case study to meet the requirements stipulated in the accompanying rubric.)
Students’ answers will depend upon those given to the previous questions but should include some discussion of similarities and differences between their own initial thoughts and principles/codes of conducts, and allude to the tensions involved in ethical dilemmas and the impact on decision making.
What are the moral values involved in this case and why does it constitute an ethical dilemma? (This is a question we had created in addition to those provided within the case study to meet the requirements stipulated in the accompanying rubric.)
Students should be able to identify relevant moral values and explain that an ethical dilemma constitutes a problem in which two or more moral values or norms cannot be fully realised at the same time.
There are two (or a limited number of) options for action and whatever they choose they will commit a moral wrong. The crucial feature of a moral dilemma is not the number of actions that are available but the fact that all possible actions are morally unsatisfactory.
What role should an engineer play in influencing the outcome? What are the implications of not being involved? (This is a question we had created in addition to those provided within the case study to meet the requirements stipulated in the accompanying rubric.)
Engineers are responsible for the design of technological advancements which necessitate data storage. Although this brings many benefits, engineers need to consider the adverse impact of technological advancement such as increased water use. Students may therefore want to consider the wider implications of data storage on the environment and how these can be mitigated.
Year 2
Formulate a moral problem statement which clearly states the problem, its moral nature and who needs to act. (This is a question we had created in addition to those provided within the case study to meet the requirements stipulated in the accompanying rubric.)
An example could be: “Should the civil engineer working for DSS remain loyal to the company and defend them against accusations of causing environmental hazards, or defend their water rights and say that they will not change their behaviour”. It should be clear what the problem is, the moral values at play and who needs to act.
Stakeholder mapping: Who are all the stakeholders in the scenario? What are their positions, perspective and moral values?
Below is a non-exhaustive list of some of the relevant stakeholders and values that may come up.
Stakeholder
Perspectives/interests
Moralvalues
DataStorageSolutions (DSS)
Increasing production in a profitable way; meeting legal requirements; good reputationtomaintain/grow customer base.
Representviewsofthose concerned about biodiversity. May be interested in opening ofgreenbattery plant.
Human welfare; environmental sustainability;justice.
LocalCouncil
Represent views of all stakeholders and would needtoconsidereconomic benefits of DSS (tax and employment), the need of theuniversityandhospital, as well as the needs of local farmers and environmentalists. May beinterestedinopeningof green battery plant.
This may depend on their beliefs as an individual, their employment status and their use of services such as the hospital and university. Typically interested in low taxes/responsible spending of public money. May be interested in opening of green batteryplant.
Reliable storage. They mayalsobeinterestedin being part of an ethical supply chain.
Trust; privacy; accountability;autonomy.
Non-humanstakeholders
Environmental sustainability.
What are some of the possible courses of action in the situation. What responsibilities do you have to the various stakeholders involved? What are some of the advantages and disadvantages associated with each? (Reworded from case study.)
Students should provide a stance but may recognise the tensions involved. For example, at a micro level, tensions between loyalty to the profession and loyalty to the company/personal financial stability. Responsibilities to fellow employees may include the degree to which you risk their jobs by being honest. They may also feel that they should protect environmental and natural resources.
At a macro level, they may consider the need for engineers to inform decisions regarding issues that engineering and technology raise for society (e.g. increased water being needed for data storage) and listen to the aspirations and concerns of others, and challenging statements or policies that cause them professional concern.
What are the relevant facts in this scenario and what other information would you like to help inform your ethical decision making? (This is a question we had created in addition to those provided within the case study to meet the requirements stipulated in the accompanying rubric.)
Students should identify which facts within the case study are relevant in terms of making an ethical decision. In this case, some of the relevant facts may include:
Water use permissible by law (“the data centre always uses the maximum amount legally allotted to it.”)
This centre manages data which is vital for the local community, including the safe running of schools and hospitals, and that its operation requires sufficient water for cooling.
In more arid months, the nearby river almost runs dry, resulting in large volumes of fish dying.
Water levels in farmers’ wells have dropped, making irrigation much more expensive and challenging.
A new green battery plant is planned to open nearby that will create more data demand and has the potential to further increase DSS’ water use.
Obtaining water from other sources will be costly to DSS and may not be practically possible, let alone commercially viable.
Studentsshouldbeawarethatincompleteinformationhindersdecisionmakingduring ethical dilemmas, and that in some cases, further information will be needed to help inform decisions. In this case, some of the questions may pertain to:
Exactly how much water is being used and the legal rights.
Relationship between farmer and DSS/contractual obligations.
How costly irrigation is to the farmers (economic impact), as well as the knock-on impact to their business and supply chain.
How many people DSS employ and how important they are for local economy.
Detail regarding biodiversity loss and its wider impact.
How likely it is that the green battery plant will open and whether DSS is the only eligible supplier.
How much the green battery plant contract is worth to DSS.
How much water the green battery plant will use in the case that DSS get the contract.
Whether DSS is the only option for hospital and university.
What will happen if the services DSS provide to the hospital and university stop or becomes unreliable.
Year 2/Year 3
(At Year 2, students could provide options; at Year 3 they would evaluate and form a judgement.)
Make use of ethical frameworks and/or professional codes to evaluate the options for DSS both short term and long term. How do the uncertainty and assumptions involved in this case impact decision making?
Students should list plausible options. They can then analyse them with respect to different ethical frameworks (whilst we don’t necessary make use of normative ethical theories, analysis according to consequences, intention or action may be a useful approach to this). Below we have included a non-exhaustive list of options with ideas in terms of analysis.
Option
Consequences
Intention
Action
Keepusing water
May lead to expansion and profit of DSS and thus tax revenue/employment and supply.
Reputational damage of DSS may increase. Individual employee piece of mind may be at risk.
Farmers still don’t have water and biodiversity still suffers which may have further impact long term.
Intentionbehindaction notconsistentwith that expected by an engineer, other than with respect to legality
Actionfollowslegalnormsbut not social norms such as good will and concern for others.
Keep using the water but limit furtherwork
May limit expansion and profit of DSS and thus tax revenue/employment and supply.
Farmers still don’t have water and biodiversity still suffers and may have further impact long term. This could still result in reputation damage.
Intentionbehindaction partially consistent with that expected by an engineer.
Actionfollowslegalnormsbut only partially follow social norms such as good will and concern for others.
Makeuseof other sources of water
Data storage continues.
Potential for reputation to increase.
Potential increase in cost of water resulting in less profit potentially less tax revenue/employment.
Farmers have water and biodiversity may improve.
Alternativewatersourcesmaybeassociated with the same issues or worse.
Intention behind action seems consistent with that expected by an engineer. However, this is dependent upon
whether they chose to source sustainablewaterwithlessimpact on biodiversity etc.
Thismaybedependenton the degree to which DSS proactively source sustainable water.
Reduce worklevels or shut down
Impact on profit and thus tax revenue/employment and supply chain. Farmers have water and biodiversity may improve.
May cause operational issues for those whose data is stored.
Seems consistent with those expected of engineer. Raises questions more generally about viability and feasibility of datastorage.
Action doesn’t follow social norms of responsibility to employeesandshareholders.
Investigate othercooling methods which don’t require as much water/don’t take on extra work untilanother method identified.
May benefit whole sector.
May cause interim loss of service.
This follows expectations of the engineeringprofession in terms of evidence-baseddecisionmaking and consideration for impact of engineering in society.
It follows social norms in termsofresponsibledecision making.
Any views, thoughts, and opinions expressed herein are solely that of the author(s) and do not necessarily reflect the views, opinions, policies, or position of the Engineering Professors’ Council or the Toolkit sponsors and supporters.
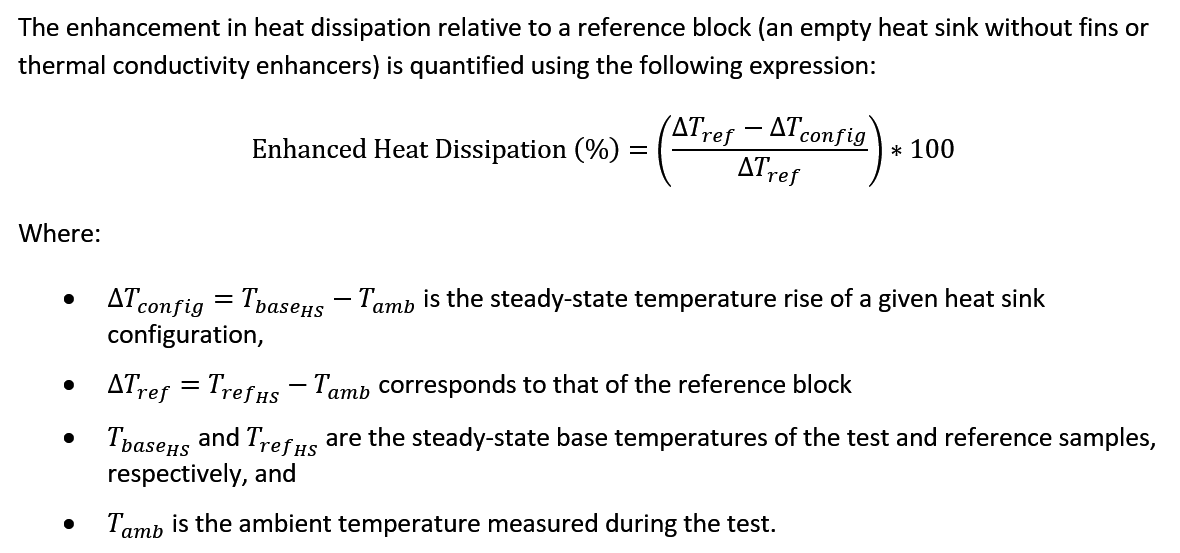
Author: Dr Gill Lacey, SFEA, MIEEE (Teesside University).
Topic: Calculating effects of implementing energy-saving standards.
Keywords: Built environment; Housing; Energy efficiency; Decarbonisation; AHEP; Sustainability; Higher education; Pedagogy.
Sustainability competency: Systems thinking; Critical thinking; Integrated problem-solving.UNESCO has developed eight key competencies for sustainability that are aimed at learners of all ages worldwide. Many versions of these exist, as are linked here*. In the UK, these have been adapted within higher education by AdvanceHE and the QAA with appropriate learning outcomes. The full list of competencies and learning outcome alignment can be found in the Education for Sustainable Development Guidance*. *Click the pink ''Sustainability competency'' text to learn more.
AHEP mapping: This resource addresses several of the themes from the UK’s Accreditation of Higher Education Programmes fourth edition (AHEP4): The Engineer and Society (acknowledging that engineering activity can have a significant societal impact) and the following specific themes from Engineering Practice (the practical application of engineering concepts, tools and professional skills). To map this resource to AHEP outcomes specific to a programme under these themes, access AHEP 4 here and navigate to pages 30-31 and 35-37.
F1.Apply knowledge of mathematics, statistics, natural science and engineering principles to broadly defined problems.
F4.Select and use technical literature and other sources of information to address broadly defined problems.
F6.Apply a systematic approach to the solution of broadly-defined problems.
F7. Evaluate the environmental and societal impact of solutions to broadly-defined problems.
Related SDGs: SDG 11 (Sustainable Cities and Communities); SDG 12 (Responsible Consumption and Production); SDG 13 (Climate Action).
Reimagined Degree Map Intervention: Active pedagogies and mindsets; More real-world complexity.The Reimagined Degree Map is a guide to help engineering departments navigate the decisions that are urgently required to ensure degrees prepare students for 21st century challenges. Click the pink ''Reimagined Degree Map Intervention'' text to learn more.
Educational level: Beginner / intermediate. Learners are required to have basic (level 2) science knowledge, and ability to populate a mathematical formula and use units correctly.
Learning and teaching notes:
This activity allows students to consider the dilemmas around providing housing that is cheap to heat as well as cheap to buy or rent. It starts with researching these issues using contemporary news and policy, continues with an in-depth study of insulation, together with calculations of U values, heat energy and indicative costs.
Learners have the opportunity to:
solve given technical tasks relating to insulation properties (AHEP: SM1m)
assess the heating requirement of a given house (AHEP: EA1m)
research a contemporary issue using websites and guided material
Teachers have the opportunity to:
introduce concepts related to heating and energy theory
develop learners’ mathematical skills in a practical context.
Structure a task around a sustainability issue and recognise the economic, social and cultural issues, as well as the technical ones
Supporting resources:
To prepare for these activities, teachers may want to explain, or assign students to pre-read articles relating to heating a house with respect to:
Provide the stimulus to motivate the students by considering the dilemma: How do we provide affordable housing whilst minimising heating requirement? There are not enough homes in the UK for everyone who needs one. Some of the houses we do have are expensive to run, poorly maintained and cost a fortune in rent. How do we get the housing builders to provide enough affordable, cheap to run housing for the population?
One possible solution is adopting Passivhaus standards. The Passivhaus is a building that conforms to a standard around heating requirements that ensures the insulation (U value) of the building material, including doors, windows and floors, prevents heat leaving the building so that a minimum heating requirement is needed. If all houses conformed to Passivhaus standards, the running costs for the householder would be reduced.
Teaching schedule:
Provide stimulus by highlighting the housing crisis in the UK:
How many houses are needed, now and in the future?
How many people currently live in temporary accommodation, and is this number expected to change?
Are developers required to add affordable housing to their plot? Should they be?
People requiring affordable housing for rent are likely to be among the poorest, so how many people are in ‘fuel poverty’?
Affordable housing needs to be built in such a way as to minimise the heat needed to keep the house warm. What categories of people are especially vulnerable?
What features/standards must a Passivhaus satisfy? How does this standard address the problems?
Students can work in groups to work on the extent of the problem from the bullet points provided. This activity can be used to develop design skills (Define the problem)
1. Get the engineering knowledge about preventing heat leaving a house:
If you can prevent heat leaving, you won’t need to add any more, it will stay at the same temperature. Related engineering concepts are:
Newtons law of cooling
U values
Heat transfer
2. Task:
a. Start with a standard footprint of a three-bed semi, from local estate agents. Make some assumptions about inside and outside temperatures, height of ceilings and any other values that may be needed.
b. Use the U value table to calculate the heat loss for this house (in Watts). The excel table has been pre-populated or you can do this as a group
With uninsulated materials (single glazing, empty cavity wall, no loft insulation.
With standard insulation (double glazing, loft insulation, cavity wall insulation.
If Passivhaus standards were used to build the house.
c. Costs
Find the typical cost for heating per kWh
Compare the costs for replacing the heat lost.
d. Final synoptic activity
Passivhaus costs a lot more than standard new build. How do housebuilders afford it?
Provide examples of the cost of building a Passivhaus standard building materials and reduced heating bills.
Suggest some ‘carrots’ and ‘sticks’ that could be used to make sure housing in the UK is affordable to rent/buy and run.
3. Assessment:
The spreadsheet can be assessed, and the students could write a report giving facts and figures comparing different levels of insulation and the effects on running costs.
Any views, thoughts, and opinions expressed herein are solely that of the author(s) and do not necessarily reflect the views, opinions, policies, or position of the Engineering Professors’ Council or the Toolkit sponsors and supporters.
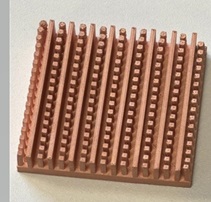
Keywords: Water and sanitation; Infrastructure; Community sustainability; Health; Government policy; Social responsibility; AHEP; Higher education; Sustainability; Project brief; Water quality control.
Sustainability competency: Systems thinking; Anticipatory; Collaboration; Integrated problem-solving; Strategic.UNESCO has developed eight key competencies for sustainability that are aimed at learners of all ages worldwide. Many versions of these exist, as are linked here*. In the UK, these have been adapted within higher education by AdvanceHE and the QAA with appropriate learning outcomes. The full list of competencies and learning outcome alignment can be found in the Education for Sustainable Development Guidance*. *Click the pink ''Sustainability competency'' text to learn more.
AHEP mapping: This resource addresses two of the themes from the UK’s Accreditation of Higher Education Programmes fourth edition (AHEP4): The Engineer and Society (acknowledging that engineering activity can have a significant societal impact) and Engineering Practice (the practical application of engineering concepts, tools and professional skills). To map this resource to AHEP outcomes specific to a programme under these themes, access AHEP 4 here and navigate to pages 30-31 and 35-37.
Related SDGs: SDG 3 (Good health and well-being); SDG 4 (Quality education); SDG 6 (Clean water and sanitation); SDG 8 (Decent work and economic growth).
Reimagined Degree Map Intervention: Active pedagogies and mindsets; More real-world complexity.The Reimagined Degree Map is a guide to help engineering departments navigate the decisions that are urgently required to ensure degrees prepare students for 21st century challenges. Click the pink ''Reimagined Degree Map Intervention'' text to learn more.
Educational level: Intermediate.
Learning and teaching notes:
This is an example project that could be adapted for use in a variety of contexts. It asks students to devise a “sustainability dashboard” that can not only track indicators of river system sustainability through technical means, but also communicate the resulting data to the public for the purpose of policy decisions. Teachers should ideally select a local river system to focus on for this project, and assign background reading accordingly.
Learners have the opportunity to:
Investigate the links between history, politics, and engineered systems;
Research existing data sources;
Devise a technical solution for community impact.
Teachers have the opportunity to:
Showcase real-world implications of the SDGs;
Integrate technical learning with sustainability issues;
Emphasise the importance of the engineer’s role in public life.
Two vital and unique resources for the planet are water and air. Any alterations in their composition can have detrimental effects on humans and living organisms. Water uses across New Mexico are unsustainable. Reduced precipitation and streamflows cause increased groundwater use and recharge. Serious omissions in state water policy provide no protection against complete depletion of groundwater reserves.
The water governance status quo in New Mexico will result in many areas of New Mexico running out of water, some sooner, some later, and some already have. Because Water is Life, water insecurity will cause economic insecurity and eventual collapse.
Water resources, both surface and groundwater, and total water use, determine the amount of water use that can be sustained, and then reduce total water use if New Mexico is to have water security. The public must therefore recognise that action is required. Availability of compiled, accessible data will lead to and promote our critical need to work toward equitable adaptation and attain sustainable resiliency of the Middle Rio Grande’s common water supply and air quality.
A data dashboard is needed to provide on-line access to historical, modern, and current perspectives on water, air quality, health, and economic information. A dashboard is needed to help inform the public about why everyone and all concerned citizens, institutions and levels of government must do their part!
Project brief:
The Middle Rio Grande region of New Mexico has particular sustainability and resilience requirements and enforceable legal obligations (Rio Grande Compact) to reduce water depletions of the Rio Grande and tributary groundwater to sustainable levels. However, there is a lack of accessible depictions of the Middle Rio Grande’s water supply and demand mismatch. Nothing publicly accessible illustrates the surface water and groundwater resources, water uses, and current water depletions that cannot be sustained even if water supplies were not declining. Therefore, there is a corresponding lack of public visibility of New Mexico’s water crisis, both in the Middle Valley and across New Mexico. Local water institutions and governments are siloed and have self-serving missions and do not recognise the limits of the Middle Valley’s water resources.
A water data dashboard is needed to provide online open access to historical, modern, and current perspectives on water inflows, outflows, and the change in stored surface and groundwater. This dashboard should inform the public about why everyone and all water institutions and levels of government must do their part!
Given:
Data from numerous on-line and paper or spreadsheet data sources
Law of the Rio Grande
The 2004 water budget components and historical information.
Objectives:
Engage data providers to cooperatively secure access to the public data they collect and maintain.
Create one website Dashboard to present the relevant water data of the Middle Rio Grande.
Demonstrate the function and form of the Water Data Dashboard to illustrate the value of simplified presentation of aggregated data.
Illustrate the value of creating procedures for data aggregation and presentation in simplified, accessible formats so that the prototype dashboard is taken over by an institution with the resources to build and maintain an improved second-generation version.
Provide selected water data sets as set forth in 2019 Water Data Act standards and procedures to the NM Water Data Initiative.
Find a long-term home for the dashboard project with a government agency or Middle Rio Grande water institution.
Acknowledgements: The 2023 Peace Engineering summer cohort of Argentine Fulbright Scholars who analysed the Middle Rio Grande Case Study concluded that water in the Middle Rio Grande is a community problem that requires a community driven solution.
Any views, thoughts, and opinions expressed herein are solely that of the author(s) and do not necessarily reflect the views, opinions, policies, or position of the Engineering Professors’ Council or the Toolkit sponsors and supporters.