
 To see how your institution has fared in each of the engineering Units of Assessment, click on the picture and download the Excel workbook (100kB). You will need Excel version 10. If you receive the message “This workbook contains links to other data sources, do you wish to update?”, click on “Don’t update”.
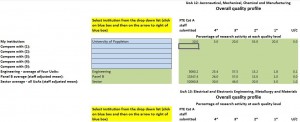
Here, you will be able to compare the outcome for your institution with up to 5 others for both the overall profile and the sub profiles (Outputs, Impact and Environment), as well as seeing the summary results for Panel B, which encompassed the engineering Units of Assessment and for all disciplines. The contextual data (number of staff submitted as a proportion of number of eligible staff) is included. Scroll down and click on the dropdown boxes below for summaries of the results for each of the engineering Units of Assessment, including each institution’s Research Fortnight quality index.
Four of the EPC’s Executive Committee were REF 2014 main panellists. Two of them, Professors Alison Hodge and Stephanie Haywood, provided an insight into the work of the panel in their workshop session at Congress 2015. You can access their presentation here.
Average profiles and rankings
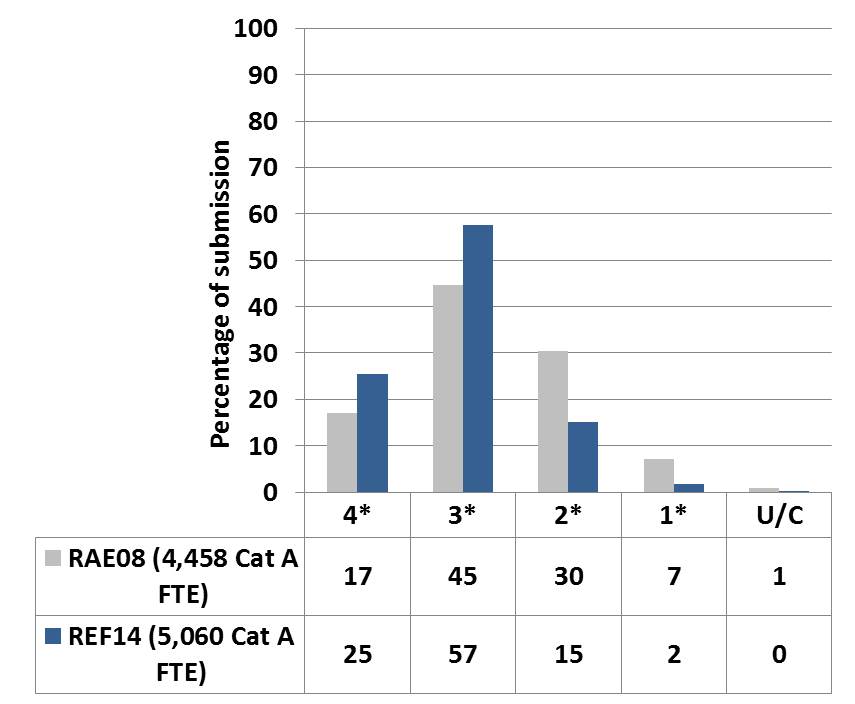
Average staff-adjusted profile for the engineering Units of Assessment – comparison with 2008 Research Assessment Exercise.
For the university-level rankings, see the Guardian website:
The Guardian has used the Research Fortnight methodology to provide a ranking based on the HEFCE volume-based quality-related funding methodology*.
For more information about the Research Excellence Framework go to https://webarchive.nationalarchives.gov.uk/ukgwa/20170712123221/http://blog.hefce.ac.uk/2014/12/18/research-excellence-in-numbers/
The Times Higher Education has also published rankings, one using GPA…
THES-refoverallrankingsofinstitutionsbythe-1.pdf
…and one ranking institutions based on “research intensity”:
THES subject ranking on intensity.pdf
Research Fortnight ranking – market share (adjusted for number of staff submitted). The HEFCE grant letter issued in February indicates that the funding pot will stay the same for 2015/16 so this is the best indicator of whether your quality-related research funding (“QR”) will have increased or decreased…
*Methodology: To calculate the rankings, Research Fortnight weighted the data by the number of staff each institution submitted to the exercise, as this helps determine the total funding allocation each institution receives. For each unit of assessment, they multiplied the percentage of research deemed to fall into each quality level, for example 4* or 3*, by the number of FTE staff submitted for that unit. They then summed these totals and divided by the total FTE of staff at that institution submitted. They generated the Research Fortnight Quality Index by weighting the profiles based on the expected funding allocations: 75 per cent of funding going to 4* and 25 per cent to 3* with no other categories funded. They multiplied the percentage in each category by the allocated weight and then divided the total sum by the largest weight, 3 in this instance. They used this to generate the Power ratings that determine their rankings, by multiplying the Quality Index by the total FTE of staff submitted and then dividing by the largest resulting value. This produces Power numbers adjusted to a percentage of the largest value. The top value is 100 and everything else is a percentage of this. They also generated a predicted market share, by multiplying the Quality Index by the FTE of staff submitted and then dividing by the total of all the resulting values. It represents the slice of the funding pie each institution might take. They say they recognise that their “rankings favour volume over quality, but this merely reflects the realities of the current funding climate”.
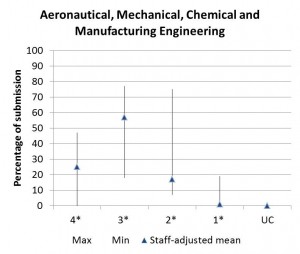
UoA 12 Aeronautical, Mechanical, Chemical and Manufacturing Engineering
Click on the chart to download Excel workbook of summary information (29kB). Includes sub profile summaries, numbers of staff entered and numbers of eligible staff for each Unit of Assessment.
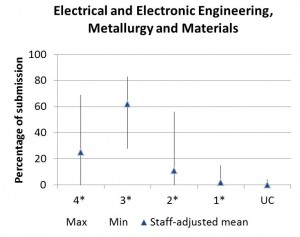
UoA 13 Electrical and Electronic Engineering, Metallurgy and Materials
Click on the chart to download Excel workbook of summary information (32kB).
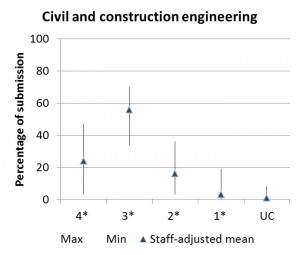
UoA 14 Civil and Construction Engineering
Click on the chart to download Excel workbook of summary information (24kB).
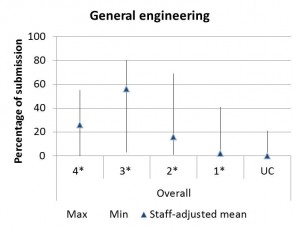
UoA 15 General Engineering
Click on the chart to download Excel workbook of summary information (40kB).
Funding implications
The Scottish Funding Council was first to announce indicative funding decisions for the Research Excellence Grant for AY 2015/16 to AY 2017/18. You can download a copy here.
The 2015/16 allocations for English universities may be found here showing the comparison with 2014/15. See also HEFCE announcement regarding principles for distribution of QR here.
The Welsh QR allocations for AY 2015/16 may be found here.
Searchable REF impact database
HEFCE has published a searchable tool that makes the REF impact case studies widely available. It enables analysis and automated text mining.
http://impact.ref.ac.uk/CaseStudies/search1.aspx