Downloads: A PDF of this resource will be available soon.
Who is this article for?: This article should be read by educators at all levels of higher education looking to highlight the connection between complex systems and sustainability within engineering learning.
Related INCOSE Competencies: Toolkit resources are designed to be applicable to any engineering discipline, but educators might find it useful to understand their alignment to competencies outlined by the International Council on Systems Engineering (INCOSE). The INCOSE Competency Framework provides a set of 37 competencies for Systems Engineering within a tailorable framework that provides guidance for practitioners and stakeholders to identify knowledge, skills, abilities and behaviours crucial to Systems Engineering effectiveness. A free spreadsheet version of the framework can be downloaded.
This resource relates to the Systems Thinking, Life Cycles, Capability Engineering, Systems Modelling and Analysis, and Design INCOSE competencies.
AHEP mapping: This resource addresses several of the themes from the UK’s Accreditation of Higher Education Programmes fourth edition (AHEP4): Analytical Tools and Techniques (critical to the ability to model and solve problems), and Integrated / Systems Approach(essential to the solution of broadly-defined problems). In addition, this resource addresses AHEP themes of Materials, equipment, technologies and processes, and Sustainability.
Several sustainability challenges, such as transitioning to a circular economy, are embedded in complex socio-technical systems. A circular economy is an economic model that replaces the linear take-make-dispose pattern with systems that keep materials and products in use for longer through designing for durability, reuse, remanufacturing, and recycling, while minimising waste and regenerating natural systems (Rizos, Tuokko, and Behrens, 2017).
Complex systems like these exhibit feedback loops, delays, non-linear change, path dependence and emergent behaviour (Sterman, 2000; Meadows, 2008). This article introduces the idea of systems-based interventions using the example of aluminium recycling systems. It is designed for engineering educators who plan to provide learners with a baseline understanding of complexity and practical entry points for designing and developing and evaluating interventions that can move a system towards sustainability.
Complexity of aluminium recycling systems:
Aluminium is infinitely recyclable, yet achieving truly closed material loops at scale remains a challenge. Most of today’s recycling occurs in situations where post-consumer scrap is collected from a wide variety of end-of-life products and the boundaries of the recycling system are difficult to define and control. This creates high variability in both the composition and the quality of recovered aluminium, since different products contain different alloys and levels of contamination (IRT M2P, 2023). At the same time, the volume of available scrap is difficult to predict, as it depends on product lifespans and consumer behaviour. These fluctuations make it harder for producers to plan and optimise secondary aluminium output, particularly when industries rely on consistent standards or just-in-time manufacturing.
The recycling system is also shaped by broader economic and regulatory forces. On the one hand, demand for low-carbon materials and the cost advantage of recycled over primary aluminium are powerful drivers of growth. On the other hand, the system faces constraints from volatile scrap prices and shifting global trade dynamics, such as U.S. tariffs on aluminium imports. Meanwhile, new policy instruments are adding further complexity. The EU’s Carbon Border Adjustment Mechanism (CBAM) is set to reshape trade flows and investment patterns, while the forthcoming Digital Product Passport (DPP) will transform how information is shared across the value chain. Together, these forces influence technologies, markets and business models, underscoring the dynamic and interconnected nature of aluminium recycling.
These interconnected factors highlight aluminium recycling as a complex socio-technical system, in which technological capabilities, market incentives, policy frameworks, and global trade are deeply interconnected. For educators, this makes aluminium an effective example for teaching students how multiple forces interact to create both opportunities and challenges for sustainable engineering.
Intervention from systems perspective:
System Dynamics (SD), first formalised byForrester (1968), has proven to be a highly valuable approach for understanding and managing complex resource and recovery systems. SD is an interdisciplinary approach, drawing on insights from psychology, organisational theory, economics, and related fields (Sterman, 2000). More supporting information about SD pedagogical tools and techniques can be found through the System Dynamics Society and Insight Maker.
From a systems perspective, interventions are not isolated events but strategic effort to influence system behaviour by targeting its structure and dynamics. A key concept here is leverage points – places within a complex system where small changes can lead to significant, systemic effects (Meadows, 1999). Meadows identified twelve types of leverage points, ranging from adjusting parameters to transforming the system’s underlying goals and paradigms, proving a conceptual framework for identifying impactful intervention.
Figure 1. Donella Meadows’ leverage points (Source: based on Meadows (1999); credit: UNDP/Carlotta Cataldi; reproduced fromBovarnick and Cooper (2021))
Exploration of potential leverage points:
System Dynamics (SD) tools such as Causal Loop Diagrams (CLDs) can help explore leverage points. CLDs can help visualise main components of a system and their interdependencies, making complex dynamics easier to understand. Besides, the process of building a CLD or more computational SD model encourages practitioners to clarify system boundaries, relationships, and drivers, laying the foundation for identifying leverage points.
For example, a CLD of aluminium recycling might capture how classification and sorting processes influence scrap quality, which then affects remelting efficiency and ultimately market uptake of recycled alloys (see Figure 2 below).
Figure 2. The causal loop diagram for auto aluminium recycling (Liu et al., 2025)
By tracing these circular cause-and-effect relationships, learners can see where interventions may ripple through the system. Highlighting reinforcing loops, balancing loops, and delays also shows why some interventions produce limited short-term results but more substantial long-term effects.
Leverage points can also be examined through the lens of information, rules, and goals. Improved information flows, such as those enabled by the Digital Product Passport, could reshape how scrap is sorted and valued. Rules, such as alloy specifications or trade tariffs, determine what types of recycled material can enter the market. At a deeper level, the goals of the system, whether to maximise throughput or to retain material value, fundamentally shape behaviour. Here too, CLDs are valuable because they allow users to visualise how changes to information, rules, or goals can shift system dynamics, providing a clearer picture of where interventions might be most effective.
Implication for educators:
This article equips educators with a focused, practical pathway to teach systems thinking through the example of aluminium recycling. Students can gain both conceptual understanding and hands-on skills to map feedback loops, identify delays, and design interventions that account for short-term trade-offs and long-term system behaviour. Teaching a single clear CLD followed by one modelling or scenario activity produces measurable learning gains while keeping the task accessible for beginners.
Educational approach:
Prioritise structure before solutions: have students map feedback loops and delays before proposing fixes.
Use one classroom-ready CLD as the anchor activity and one hands-on modelling task to test interventions.
Emphasise leverage thinking: move from parameter tweaks to information, rules, goals and paradigms as students mature.
Keep language simple and concrete: avoid jargon, introduce terms with examples, and reuse the same CLD across activities.
Use open-access tools (Insight Maker, Loopy, Vensim PLE) so students can visualise and experiment without software barriers.
Focus assessment on reasoning about system behaviour and predicted long-term effects rather than exact numerical answers.
Potential related learning outcomes within this topic:
Define stocks, flows, feedback loops, delays, reinforcing and balancing loops.
Explain why aluminium recycling is a complex socio-technical system influenced by technology, markets, policy, and information.
Construct a simple CLD for an aluminium recycling pathway and identify at least two reinforcing and one balancing loop.
Identify two leverage points and justify which one to prioritise, citing anticipated short- and long-term system effects.
Translate the CLD into a basic stock-and-flow sketch in an open-access tool and run one scenario to compare outcomes.
Further resources:
European Commission: Joint Research Centre, Environmental and socio-economic impacts of the circular economy transition in the EU cement and concrete sector – Analysing plastics material flows with life cycle-based and macroeconomic assessment models, Publications Office of the European Union, 2025, https://data.europa.eu/doi/10.2760/6579506
The Complexity and Interconnectedness of Circular Cities and the Circular Economy for Sustainability — analysis of research themes and networked interactions relevant for urban/material systems; useful for teaching complexity and cross-sector links. https://onlinelibrary.wiley.com/doi/pdf/10.1002/sd.2766
Bovarnick, A. and Cooper, S. (2021) “From what to how: rethinking food systems interventions,” Agriculture for Development. Edited by K. Hussein, 22 April, pp. 49–53.
Forrester, J.W. (1968) “Industrial Dynamics—After the First Decade,” Management Science, 14(7), pp. 398–415. Available at: https://doi.org/10.1287/mnsc.14.7.398.
Liu, M., Schneider, K., Litos, L., Salonitis, K., 2025. Enhancing Secondary Aluminium Supply: Optimising Urban Mining Through a Systems Thinking Approach, in: Edwards, L. (Ed.), Light Metals 2025. Springer Nature Switzerland, Cham, pp. 1273–1279.
Meadows, D.H. (1999) Leverage Points – Places to Intervene in a System, The Sustainability Institute.
Meadows, D.H. (2008) Thinking in systems: A primer. White River Junction, VT: Chelsea Green Publishing Company.
Sterman, J. (2000) “Business Dynamics, System Thinking and Modeling for a Complex World.” Available at: http://hdl.handle.net/1721.1/102741 (Accessed: September 4, 2025).
Any views, thoughts, and opinions expressed herein are solely that of the author(s) and do not necessarily reflect the views, opinions, policies, or position of the Engineering Professors’ Council or the Toolkit sponsors and supporters.
Licensing:This work is licensed under a Creative Commons Attribution-ShareAlike 4.0 International License. It is based upon the author’s 2025 article “A Simulation Tool for Pinch Analysis and Heat Exchanger/Heat Pump Integration in Industrial Processes: Development and Application in Challenge-based Learning”. Education for Chemical Engineers 52, 141–150.
Related INCOSE Competencies: Toolkit resources are designed to be applicable to any engineering discipline, but educators might find it useful to understand their alignment to competencies outlined by the International Council on Systems Engineering (INCOSE). The INCOSE Competency Framework provides a set of 37 competencies for Systems Engineering within a tailorable framework that provides guidance for practitioners and stakeholders to identify knowledge, skills, abilities and behaviours crucial to Systems Engineering effectiveness. A free spreadsheet version of the framework can be downloaded.
This resource relates to the Systems Thinking, Systems Modelling and Analysis and Critical Thinking INCOSE competencies.
AHEP mapping: This resource addresses several of the themes from the UK’s Accreditation of Higher Education Programmes fourth edition (AHEP4): Analytical Tools and Techniques (critical to the ability to model and solve problems), and Integrated / Systems Approach (essential to the solution of broadly-defined problems). In addition, this resource addresses the themes of Science, mathematics and engineering principles; Problem analysis; and Design.
Educational level: Intermediate.
Educational aim:To equip learners with the ability to model, analyse, and optimise pathways for industrial decarbonisation through a complex-systems lens – integrating technical, economic, and policy dimensions – while linking factory-level design decisions to wider value-chain dynamics, multi-stakeholder trade-offs, and long-term sustainability impacts.
Learning and teaching notes:
This teaching activity explores heat integration for the decarbonisation of industrial processes through the lens of complex systems thinking, combining simulation, systems-level modelling, and reflective scenario analysis. It is especially useful in modules related to energy systems, process systems, or sustainability.
Learners analyse a manufacturing site’s energy system using a custom-built simulation tool to explore the energy, cost and carbon-emission trade-offs of different heat-integration strategies. They also reflect on system feedback, stakeholder interests and real-world resilience using causal loop diagrams and role-played decision frameworks.
This activity frames industrial heat integration as a complex adaptive system, with interdependent subsystems such as process material streams, utilities, technology investments and deployments, capital costs, emissions, and operating constraints.
Learners run the simulation tool to generate outputs to explore different systems integration strategies: pinch-based heat recovery by heat exchangers, with and without heat pump-based waste heat upgrade. Screenshots of the tool graphical user interface are attached as separate files:
The learning is delivered in part, through active engagement with the simulation tool. Learners interpret the composite and grand composite curves and process tables, to explore how system-level outcomes change across various scenarios. Learners explore, using their generated simulation outputs, how subsystems (e.g. hot and cold process streams, utilities) interact nonlinearly and with feedback effects (e.g., heat recovery impacts), shaping global system behaviour and revealing leverage points and emergent effects in economics, emissions and feasibility.
Using these outputs as a baseline, and exploring other systems modelling options, learners evaluate trade-offs between heat recovery, capital expenditure (CAPEX), operating costs (OPEX), and carbon emissions, helping them develop systems-level thinking under constraints.
The activity embeds scenario analysis, including causal loop diagrams, what-if disruption modelling, and stakeholder role-play, using multi-criteria decision analysis (MCDA) to develop strategic analysis and systems mapping skills. Interdisciplinary reasoning is encouraged across thermodynamics, economics, optimisation, engineering ethics, and climate policy, culminating in reflective thinking on system boundary definitions, trade-offs, sustainability transitions and resilience in industrial systems.
Learners have the opportunity to:
Analyse non-linear interactions in thermodynamic systems.
Reconcile conflicting demands (e.g. energy savings vs costs vs emissions vs technical feasibility) using data generated from real system simulation.
Model and interpret feedback-driven process systems using pinch analysis, heat recovery via heat exchangers, and heat upgrade via heat pump integration.
Explore emergent behaviour, trade-offs, and interdisciplinary constraints.
Navigate system uncertainties by simulation data analysis and scenario thinking.
Understand the principles of heat integration using pinch analysis, heat exchanger networks, and heat pump systems, framed within complex industrial systems with interdependent subsystems.
Evaluate decarbonisation strategies and their performances in terms of energy savings, CAPEX/OPEX, carbon reduction, and operational risks, highlighting system-level trade-offs and nonlinear effects
Develop data-driven decision-making, navigating assumptions, parameter sensitivity, and model limitations, reflecting uncertainty and systems adaptation.
Explore ethical, sustainability, and resilience dimensions of engineering design, recognising how small changes or policy shifts may act on leverage points and produce emergent behaviours.
Analyse stakeholder dynamics, policy impacts, and uncertainty as part of the broader system environment influencing energy transition pathways.
Construct and interpret causal loop diagrams (CLDs), explore what-if scenarios, and apply multi-criteria decision analysis (MCDA), building competencies in feedback loops, system boundaries, and systems mapping.
Teachers have the opportunity to:
Embed systems thinking and complex systems pedagogy into energy and process engineering, using real-world simulations and data-rich problem-solving.
Introduce modelling and scenario-based reasoning, helping students understand how interactions between process units, energy streams, and external factors affect industrial decarbonisation.
Facilitate exploration of design trade-offs, encouraging learners to consider technical feasibility, economic sustainability, and environmental constraints within dynamic system contexts.
Support students in identifying leverage points, feedback loops, and emergent behaviours, using tools like CLDs, composite curves, and stakeholder role play.
Assess complex problem-solving capacity, including students’ ability to model, critique and adapt industrial systems under conflicting constraints and uncertain futures.
Proprietary Simulator for Pinch Analysis & Heat Integration. Freely available for educational use and can be accessed online through a secure link provided by the author on request (james.atuonwu@nmite.ac.uk or james.atuonwu@gmail.com). No installation or special setup is required; users can access it directly in a web browser.
About the simulation tool (access and alternatives):
This activity uses a Streamlit-based simulation tool, supported with process data (Appendix A, Table 1, or an educator’s equivalent). The tool is freely available for educational use and can be accessed online through a secure link provided by the author on request (james.atuonwu@nmite.ac.uk or james.atuonwu@gmail.com). No installation or special setup is required; users can access it directly in a web browser.The activity can also be replicated using open-source or online pinch analysis tools such as OpenPinch, PyPinchPinCH, TLK-Energy Pinch Analysis Online. SankeyMATIC can be used for visualising energy balances and Sankey diagrams.
Pinch Analysis, a systematic method for identifying heat recovery opportunities by analysing process energy flows, forms the backbone of the simulation. A brief explainer and further reading are provided in the resources section. Learners are assumed to have prior or guided exposure to its core principles. A key tunable parameter in Pinch Analysis, ΔTmin, represents the minimum temperature difference allowed between hot and cold process streams. It determines the required heat exchanger area, associated capital cost, controllability, and overall system performance. The teaching activity helps students explore these relationships dynamically through guided variation of ΔTmin in simulation, reflection, and trade-off analysis, as outlined below.
Introducing and prioritising ΔTmin trade-offs:
ΔTmin is introduced early in the activity as a critical decision variable that balances heat recovery potential against capital cost, controllability, and safety. Students are guided to vary ΔTmin within the simulation tool to observe how small parameter shifts affect utility demands, exchanger area, and overall system efficiency. This provides immediate visual feedback through the composite and grand composite curves, helping them connect technical choices to system performance.
Educators facilitate short debriefs using the discussion prompts in Part 1 and simulation-based sensitivity analysis in Part 2. Students compare low and high ΔTmin scenarios, reasoning about implications for process economics, operability, and energy resilience.
This experiential sequence allows learners to prioritise competing factors (technical, economic, and operational), while recognising that small changes can create non-linear, system-wide effects. It reinforces complex systems principles such as feedback loops and leverage points that govern industrial energy behaviour.
Data for decisions:
The simulator’s sidebar includes some default values for energy prices (e.g. gas and electricity tariffs) and emission factors (e.g. grid carbon intensity), which users can edit to reflect their own local or regional conditions. For those replicating the activity with other software tools, equivalent calculations of total energy costs, carbon emissions and all savings due to heat recovery investments can be performed manually using locally relevant tariffs and emission factors.
The Part 1–3 tasks, prompts, and assessment suggestions below remain fully valid regardless of the chosen platform, ensuring flexibility and accessibility across different teaching contexts.
Educator support and implementation notes:
The activity is designed to be delivered across 3 sessions (6–7.5 hours total), with flexibility to adapt based on depth of exploration, simulation familiarity, or group size. Each part can be run as a standalone module or integrated sequentially in a capstone-style format.
Part 1: System mapping: (Time: 2 to 2.5 hours) – Ideal for a classroom session with blended instruction and group collaboration:
This stage introduces students to the foundational step of any heat integration analysis: system mapping. The aim is to identify and represent energy-carrying streams in a process plant, laying the groundwork for further system analysis. Educators may use the Process Flow Diagram of Fig. 1, Appendix A (from a real industrial setting: a food processing plant) or another Process Diagram, real or fictional. Students shall extract and identify thermal energy streams (hot/cold) within the system boundary and map energy balances before engaging with software to produce required simulation outputs.
Key activities and concepts include:
Defining system boundaries: Focus solely on thermal energy streams, ignoring non-thermal operations. The boundary is drawn from heat sources (hot streams) to heat sinks (cold streams).
Identifying hot and cold streams: Students classify process material streams based on whether they release or require heat. Each stream is defined by its inlet and target temperatures and its heat capacity flow rate (CP).
Building the stream table: Students compile a simple table of hot/cold streams (name, supply temperature, target temperature and heat capacity flow CP).
Constructing energy balances and Sankey Diagrams: Students manually calculate energy balances across each subsystem in the defined system boundary, identifying energy inputs, useful heat recovery, and losses. Using this information, they construct Sankey diagrams to visualise the magnitude and direction of energy flows, strengthening their grasp of system-wide energy performance before optimisation.
Pinch Concept introduction: Students are introduced to the concept of “the Pinch”, including the minimum heat exchanger temperature difference (ΔTmin) and how it affects heat recovery targets (QREC), as well as overall heating and cooling utility demands (QHU & QCU, respectively).
Assumptions: All analysis is conducted under steady-state conditions with constant CP and no heat losses.
Discussion prompts:
What insights does the Sankey diagram reveal about energy use, waste and recovery potential in the system? How might these visual insights shape optimisation decisions?
Why might certain streams be excluded from the analysis?
How does the choice of ΔTmin influence the heat recovery potential and cost?
What trade-offs are involved in system simplification during mapping?
How can assumptions (like steady-state vs. transient) impact integration outcomes?
Student deliverables:
A labelled system map showing the thermal process boundaries, hot and cold streams.
A structured stream data table.
Justification for selected ΔTmin values based on process safety, economics, or practical design and operational considerations.
A basic Sankey diagram representing the energy flows in the mapped system, based on calculated heat duties of each stream.
Part 2: Running and interpreting process system simulation results (Time: 2 to 2.5 hours) – Suitable for lab or flipped delivery;only standard computer access is needed to run the tool (optional instructor demo can extend depth):
Students use the simulation tool to generate their own results.The process scenario of Fig. 1, Appendix A, with the associated stream data (Table 1) can be used as a baseline.
Tool-generated outputs:
Curves: Composite and Grand Composite (pinch location, recovery potential).
Scenario summary: QREC, QHU, QCU; COP (where applicable); CAPEX/OPEX/CO₂; payback period for various values of system levers (e.g., ΔTmin levels, tariffs, emission factors).
Heat Pump (HP) tables: Feasible pairs, Top-N heat pump selections (where N = 0, 1, or 2); QEVAP, QCOND, QCOMP, COP. All notations are designated in the simulator’s help/README section.
Learning tasks:
1. Scenario sweeps Run different scenarios (e.g., different ΔTmin levels, tariffs, emission factors, and Top-N HP selections). Prompts: How do QREC, QHU/QCU, HX area, and CAPEX/OPEX/CO₂ shift across scenarios? Which lever moves the needle most?
2. Group contrast (cases A vs B: see time-phased operations A & B in Appendix A) Assign groups different cases; each reports system behaviours and trade-offs. Prompts: Where do you see CAPEX vs. energy-recovery tension? Which case is more HP-friendly and why?
3. Curve reading Use the Composite & Grand Composite Curves to identify pinch points and bottlenecks; link features on the curves to the tabulated results. Prompts: Where is the pinch? How does ΔTmin change the heat-recovery target and utility demands?
4. Downstream implications Trace how curve-level insights show up in HX sizing/costs and HP options. Prompts: When does adding HP reduce utilities vs. just shifting costs? Where do stream temperatures/CP constrain integration?
5. Systems lens: feedback and leverage Map short causal chains from the results (e.g., tariffs → HP use → electricity cost → OPEX; grid-carbon → HP emissions → net CO₂). Prompts: Which levers (ΔTmin, tariffs, EFs, Top-N) create reinforcing or balancing effects?
Outcome:
Students will be able to generate and interpret industrial simulation outputs, linking technical findings to economic and emissions consequences through a systems-thinking lens. They begin by tracing simple cause–effect chains from the simulation data and progressively translate these into causal loop diagrams (CLDs) that visualise reinforcing and balancing feedback. Through this, learners develop the ability to explain how system structure drives performance both within the plant and across its broader industrial and policy environment.
Optional extension: Educators may provide 2–3 predefined subsystem options (e.g., low-CAPEX HX network, high-COP HP integration, hybrid retrofit) for comparison. Students can use a decision matrix to justify their chosen configuration against CAPEX, OPEX, emissions, and controllability trade-offs.
Part 3: Systems thinking through scenario analysis (Time: 2 to 2.5 hours) – Benefits from larger-group facilitation, a whiteboard or Miro board (optional), and open discussion. It is rich in systems pedagogy:
Having completed simulation-based pinch analysis and heat recovery planning, learners now shift focus to strategic implementation challenges faced in real-world industrial settings. In this part, students apply systems thinking to explore the broader implications of their heat integration simulation output scenarios, moving beyond process optimisation to consider real-world dynamics, trade-offs, and stakeholder interactions. The goal is to encourage students to interrogate the interconnectedness of decisions, feedback loops, and unintended consequences in process energy systems including but not limited to operational complexity, resilience to disruptions, and alignment with long-term sustainability goals.
Activity: Stakeholder role play / Multi-Criteria Decision Analysis Students take on stakeholder roles and debate which design variant or operating strategy should be prioritised. They then conduct a Multi-Criteria Decision Analysis (MCDA), evaluating each option based on criteria such as CAPEX, OPEX savings, emissions reductions, risk, and operational ease.
Stakeholders include:
Operations managers, focused on ease of control and process stability.
Investors and finance teams, focused on return on investment.
Environmental officers, concerned with emissions and policy compliance.
Engineers, responsible for design and retrofitting.
Community members, advocating for sustainable industry practices.
Government reps responsible for regulations and policy formulation, e.g. taxes and subsides.
The team must present a strategic analysis showing how the heat recovery system behaves as a complex adaptive system, and how its implementation can be optimised to balance technical, financial, environmental, and human considerations.
Optional STOP for questions and activities:
Before constructing causal loop diagrams (CLDs), learners revisit key results from their simulation — such as ΔTmin, tariffs, emission factors, and system costs — and trace how these parameters interact to influence overall system performance. Educators guide this transition, helping students abstract quantitative outputs (e.g., changes in QREC, OPEX, or CO₂) into qualitative feedback relationships that reveal cause-and-effect chains. This scaffolding helps bridge the gap between process simulation and systems-thinking representation, supporting discovery of reinforcing and balancing feedback structures.
Activity: Construct a causal loop diagram (CLD) Students identify at least five variables that interact dynamically in the implementation of a heat integration system (e.g. energy cost, investment risk, emissions savings, system complexity, staff training). They must map reinforcing and balancing feedback loops that illustrate trade-offs or virtuous cycles.
Where could policy or process changes trigger leverage points?
How could delays in response (e.g. slow staff adaptation to new technologies) affect outcomes?
How might design choices affect local energy equity, air quality, or community outcomes?
What policy incentives or ethical trade-offs might reinforce or hinder your proposed solution?
Instructor debrief (engineering context with simulation linkage): After students share their CLDs, the educator facilitates a short discussion linking their identified reinforcing and balancing loops to common dynamic patterns observable in the simulation results. For instance:
Limits to growth: As ΔTmin decreases, heat recovery (QREC) initially improves, but exchanger area, CAPEX, and controllability demands grow disproportionately — diminishing overall economic benefit.
Shifting the burden: Installing a heat pump may appear to improve carbon performance, but if low process efficiency remains unaddressed, electricity use and OPEX rise — creating a new dependency that shifts rather than solves the problem.
Tragedy of the commons: Competing units or stakeholders optimising locally (e.g. for their own OPEX or production uptime) can undermine total system efficiency or resilience.
Success to the successful: Design options with early financial or policy support (e.g. high-COP heat pumps) attract more investment and attention, reinforcing a positive but unequal feedback loop.
This reflection connects quantitative model outputs (e.g. QREC, OPEX, CAPEX, emissions) to qualitative system behaviours, helping learners recognise leverage points and understand how design choices interact across technical, economic, and social dimensions of decarbonisation.
Activity: Explore “What if?” scenarios
Working in groups, students choose one scenario to explore using a systems lens:
What if gas prices fluctuate drastically?
What if capital funding is delayed by 6 months?
What if a heat exchanger fouls during peak season?
What if CO₂ emissions policy tightens?
What if current electricity grid decarbonisation trends suffer an unexpected setback?
What if government policies now encourage onsite renewable electricity generation?
Each group evaluates the resilience and flexibility of the proposed integration design. They consider:
System bottlenecks and fragilities.
Leverage points for intervention.
Need for redundancy or modular design.
Educators may add advanced scenarios (e.g. carbon tax introduction, supplier failure, or project delay) to challenge students’ resilience modelling and stakeholder negotiation skills.
Stakeholder impact reflection:
To extend systems reasoning beyond the technical domain, students assess how their chosen design scenarios (e.g., low vs. high ΔTmin, with or without heat pump integration) affect each stakeholder group. For instance:
Operations managers assess control complexity, downtime risk, and maintenance implications.
Finance teams evaluate CAPEX/OPEX trade-offs and payback periods.
Environmental officers examine lifecycle emissions and regulatory compliance.
Engineers reflect on reliability, retrofit feasibility, and process safety.
Community members or regulators consider social and policy outcomes, such as visible sustainability impact or energy equity.
Each team member rates perceived benefits, risks, or compromises under each design case, and the results are summarised in a stakeholder impact matrix or discussion table. This exercise links quantitative system metrics (energy recovery, emissions, cost) to qualitative stakeholder outcomes, reinforcing the “multi-layered feedback” perspective central to complex systems analysis.
Learning Outcomes (Part 3):
By the end of this part, students will be able to:
Identify systemic interdependencies in industrial energy systems.
Analyse how feedback loops and delays influence system behaviour.
Assess the resilience of energy integration solutions under different future scenarios.
Balance multiple stakeholder objectives in complex engineering contexts.
Apply systems thinking tools to communicate complex technical scenarios to diverse stakeholder audiences.
Use systems diagrams and decision tools to support strategic analysis.
Instructor Note – Guiding CLD and archetype exploration:
Moving from numerical heat-exchange and cost data to CLD archetypes can be conceptually challenging. Instructors are encouraged to model this process by identifying at least one reinforcing loop (e.g. “energy savings → lower OPEX → more investment in recovery → further savings”) and one balancing loop (e.g. “higher capital cost → reduced investment → lower heat recovery”). Relating these loops to common system archetypes such as “Limits to Growth” or “Balancing with Delay” helps students connect engineering data to broader system dynamics and locate potential leverage points. The activity concludes with students synthesising their findings from simulation, systems mapping, and stakeholder analysis into a coherent reflection on complex system behaviour and sustainable design trade-offs.
Assessment guidance:
This assessment builds directly on the simulation and systems-thinking activities completed by students. Learners generate and interpret their own simulation outputs (or equivalent open-source pinch analysis results), using these to justify engineering and strategic decisions under uncertainty.
Assessment focuses on students’ ability to integrate quantitative analysis (energy, cost, carbon) with qualitative reasoning (feedbacks, trade-offs, stakeholder dynamics), demonstrating holistic systems understanding.
Deliverables (portfolio; individual or group):
1. Reading and interpretation of simulation outputs
Use the outputs you generate (composite & grand composite curves: HX match/area/cost tables; HP pairing/ranking; summary sheets of QHU, QCU, QREC, COP, CAPEX, OPEX, CO₂, paybacks) for a different industrial process (from the one used in the main learning activity) to:
Identify the pinch point(s) and explain what the curves imply for recovery potential and bottlenecks.
Comment on QHU/QCU/QREC and how they change across the scenarios you run (e.g., ΔTmin, tariffs, emission factors, Top-N HP selection).
Interpret trade-offs among energy, CAPEX, OPEX, emissions, using numbers reported by the simulator. No calculations beyond light arithmetic/annotation.
2. Systems mapping and scenario reasoning
A concise system boundary sketch and a simple stream table.
A Causal Loop Diagram (CLD) highlighting key feedbacks (e.g., tariffs ↔ HP use ↔ grid carbon intensity ↔ emissions/cost).
A short MCDA (transparent criteria/weights) comparing the scenario variants you test; include a brief stakeholder reflection.
3. Decision memo (max 2 pages)
Your recommended integration option under stated assumptions, with one “what-if” sensitivity (e.g., +20% electricity price, tighter CO₂ factor).
State uncertainties/assumptions and any implementation risks (operations, fouling, timing of capital).
Students should include a short reflective note addressing assumptions, feedback insights, and how their stakeholder perspective shaped their recommendation.
Appendix A: Example process scenario for teaching activity:
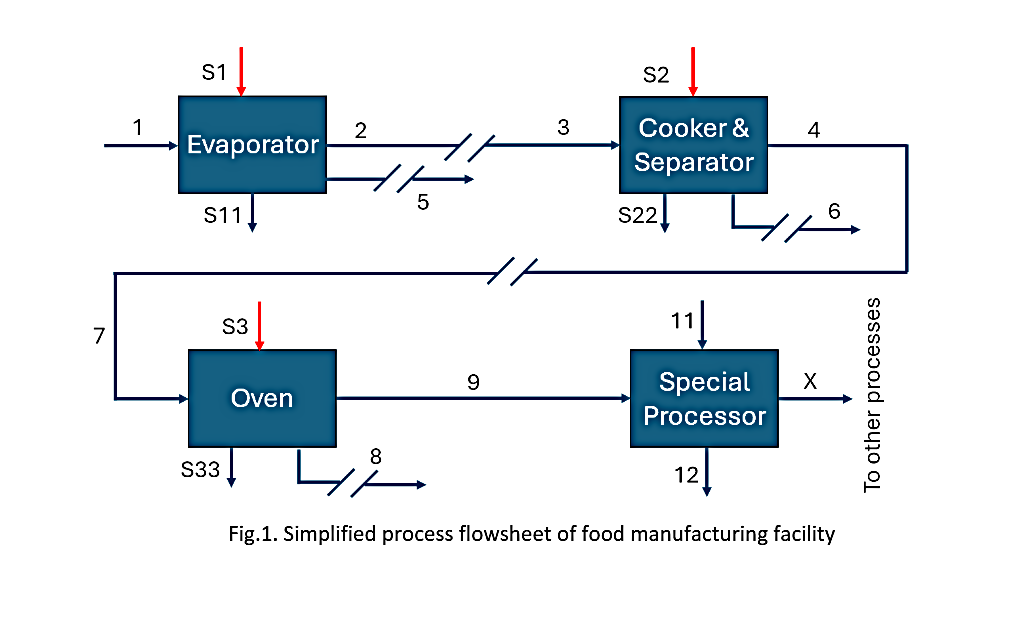
Sample narrative: Large-scale food processing plant with time-sliced operations
The following process scenario explains the industrial context behind the main teaching activity simulations. A large-scale food processing plant operates a milk product manufacturing line. The process, part of which is shown in Fig. 1, involves the following:
Thermal evaporation of milk feed.
Cooking operations after other ingredient mixing and formulation upstream.
Oven heating to drive off moisture and stimulate critical product attributes.
Pre-finishing operations as the product approaches packaging.
In real operations, the evaporation subprocessoccurs at different times from the cooking/separation, oven and pre-finishing operations. This means that their hot and cold process streams are not simultaneously available for direct heat exchange. For a realistic industrial pinch analysis, the process is thus split into two time slices:
Time Slice A (used for scenario Case A): Evaporation streams only.
Time Slice B (Case B): Cooking/separation, oven and pre-finishing streams only.
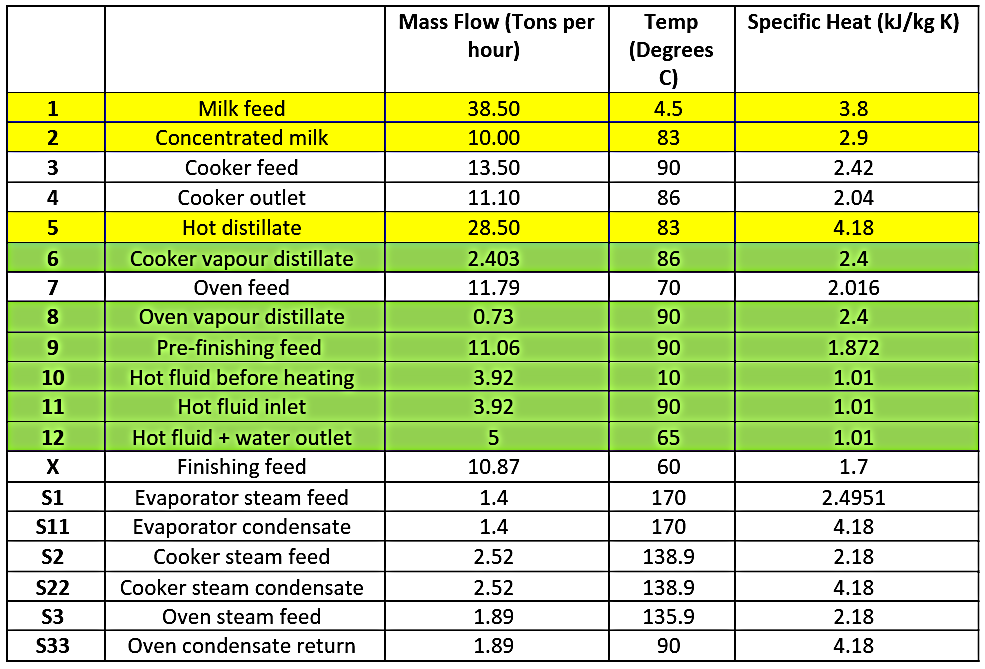
Separate pinch analyses are performed for each slice, using the yellow-highlighted sections of Table 1 as stream data for time slice A, and the green-highlighted sections as stream data for time slice B. Any heat recovery between slices would require thermal storage (e.g., a hot-water tank) to bridge the time gap.
Fig.1. Simplified process flowsheet of food manufacturing facility.
Note on storage and system boundaries:
Because the two sub-processes occur at different times, direct process-to-process heat exchange between their streams is not possible without thermal storage. If storage is introduced:
Production surplus heat at time slice A can be stored at high temperature (e.g., 80 °C) and later discharged to preheat time slice B cold streams.
The size of the tank depends on the portion of hot utility demand of sub-process B to be offset, the temperature swing, and the duration of the sub-process B.
Table 1. Process stream data corresponding to flowsheet of Fig. 1. Yellow-highlighted sections represent processes available at time slice A, while green-highlighted sections are processes available at time slice B.
Appendix B: Suggested marking rubric (Editable):
Adopter note: The rubric below is a suggested template. Instructors may adjust criteria language, weightings and band thresholds to align with local policies and learning outcomes. No marks depend on running software.
1) Interpretation of Simulation Outputs — 25%
A (Excellent): Reads curves/tables correctly; uses QHU/QCU/QREC, COP, CAPEX/OPEX/CO₂, payback figures accurately; draws clear, defensible trade-offs.
B (Good): Mostly accurate; links numbers to decisions with some insight.
C (Adequate): Mixed accuracy; limited or generic trade-off discussion.
D/F (Weak): Frequent misreads; cherry-picks or contradicts generated data.
2) Systems Thinking & Scenario Analysis — 30%
A: Clear CLD with at least one reinforcing and one balancing loop; leverage points identified; scenarios coherent; MCDA with explicit criteria, weights, and justified ranking; uncertainty acknowledged.
B: Reasonable CLD; scenarios sound; MCDA present with partial justification.
C: Superficial CLD; scenarios/MCDA incomplete or weakly reasoned.
D/F: Little or no systems view; scenarios/MCDA absent or not meaningful.
Atuonwu, J.C. (2025). A Simulation Tool for Pinch Analysis and Heat Exchanger/Heat Pump Integration in Industrial Processes: Development and Application in Challenge-based Learning. Education for Chemical Engineers 52, 141-150.
Oh, X.B., Rozali, N.E.M., Liew, P.Y., Klemes, J.J. (2021). Design of integrated energy- water systems using Pinch Analysis: a nexus study of energy-water-carbon emissions. Journal of Cleaner Production 322, 129092.
Rosenow, J., Arpagaus, C., Lechtenböhmer, S.,Oxenaar, S., Pusceddu, E. (2025). The heat is on: Policy solutions for industrial electrification. Energy Research & Social Science 127, 104227.
Bale, C.S.E., Varga, L., Foxon, T.J. (2015). Energy and complexity: New ways forward. Applied Energy 138, 150-159.
Atuonwu, J.C. (2025). Proprietary Simulator for Pinch Analysis & Heat Integration. Private reviewer access available on request (demo video or temporary login).
Any views, thoughts, and opinions expressed herein are solely that of the author(s) and do not necessarily reflect the views, opinions, policies, or position of the Engineering Professors’ Council or the Toolkit sponsors and supporters.
Downloads: A PDF of this resource will be available soon.
Who is this article for?: Thisarticle should be read by educators at all levels in higher education who are seeking an overall perspective on teaching approaches for integrating complex systems in engineering education.
Related INCOSE Competencies: Toolkit resources are designed to be applicable to any engineering discipline, but educators might find it useful to understand their alignment to competencies outlined by the International Council on Systems Engineering (INCOSE). The INCOSE Competency Framework provides a set of 37 competencies for Systems Engineering within a tailorable framework that provides guidance for practitioners and stakeholders to identify knowledge, skills, abilities and behaviours crucial to Systems Engineering effectiveness. A free spreadsheet version of the framework can be downloaded.
This resource relates to the Systems Thinking and Critical Thinking INCOSE competencies.
AHEP mapping: This resource addresses several of the themes from the UK’s Accreditation of Higher Education Programmes fourth edition (AHEP4): Analytical Tools and Techniques (critical to the ability to model and solve problems), and Integrated / Systems Approach (essential to the solution of broadly-defined problems).
Premise:
Engineering education is undergoing a fundamental transformation. The convergence of technological, social, and environmental challenges demands that future engineers move beyond procedural problem-solving toward complex thinking – a mindset capable of navigating uncertainty, interdependence, and dynamic change. This shift has been accelerated by advances in Artificial Intelligence (AI), which have redefined both the nature of engineering practice and the competencies students must develop to thrive in it.
For scientists and engineers, understanding complex systems is critical for the ability to apply knowledge and techniques across diverse contexts. This is particularly visible in fields such as bioengineering, which depends on advances in chemistry, physics, computing, and other engineering disciplines. Such integration requires designing subsystems where engineering expertise can be meaningfully applied. Complex systems also involve human interaction, introducing unpredictability, feedback loops, and uncertainty. Modern AI-enabled systems—ranging from autonomous vehicles to smart grids and biomedical devices—cannot be fully understood through a single traditional discipline. These systems are not simply complicated; they are interconnected, dynamic, and often nonlinear (Jakobsson, 2025).
What this means for engineering education and educators:
Across the globe, educators have turned to Problem-Based Learning (PBL) as a central strategy for cultivating systems-oriented thinking. For instance, Tauro et al. (2017) and the case study conducted at Tishk International University demonstrate that integrating PBL within mechatronics education enhances students’ ability to connect theory with practice, encouraging collaboration and creativity in addressing multifaceted engineering problems. Similarly, Watters et al. (2016) show that industry–school partnerships transform classrooms into real-world laboratories, reinforcing the value of experiential learning and knowledge transfer between academia and professional practice. These initiatives reflect a broader movement toward authentic, interdisciplinary engagement, a necessary foundation for understanding and designing complex systems.
However, adopting PBL and interdisciplinary methods is not only a pedagogical improvement but also an epistemological necessity. As Stegeager et al. (2024) emphasise, educators themselves must evolve from instructors to facilitators, cultivating reflective and adaptive learning environments that mirror the complexity of professional engineering contexts. Mynderse et al. further highlight that when students are given responsibility for solving open-ended problems, they report higher satisfaction and deeper conceptual integration. These outcomes suggest that active learning approaches foster the kind of complex, interconnected reasoning required for contemporary engineering practice.
In parallel, the AI-driven classroom is transforming the educational landscape. Emerging evidence shows that generative AI tools support personalised learning and immediate feedback, freeing educators to focus on mentorship and creativity (Jaramillo, 2024). Yet this technological advancement also underscores the limits of automation. Machines can model and predict, but they cannot interpret ethical implications, reconcile trade-offs, or integrate human and ecological perspectives. This is where complex thinking becomes indispensable: it enables learners to understand AI not merely as a computational tool but as a component within broader sociotechnical systems.
The need for complex systems understanding is especially acute in fields such as bioengineering and mechatronics, where technologies intersect with living systems and social contexts. The defining feature of complex systems is the interaction among multiple components that produce emergent, often unpredictable behaviour. For engineering students, grasping these principles means developing the ability to think beyond linear causality and to engage with feedback loops, uncertainty, and adaptive design.
The imperative to transform engineering education:
In traditional engineering education, students get topics presented in discrete classes. They get trained in thermodynamics and fluid mechanics and they often forget what they have learned by the time they are at the control systems course where there is an opportunity to bring together skills from prior knowledge. This modularised model is already losing its effectiveness in preparing the students for encountering real-world problems. As the adage says, “In theory, theory and practice are the same; in practice, they are not”. Understanding the role of noise, measurement errors, simplifying assumptions and computational errors play an essential role. To this end, it is crucial to centre complex system design and embrace interdisciplinarity to develop a competency that supports life-long, adaptive learning.
As an example, Aalborg University in Denmark stands as a global exemplary of systems-oriented engineering education. Its PBL model is not an add-on; it is the spine of the entire curriculum. Every semester, students tackle a new problem – often tied to societal needs such as urban planning, environmental sustainability, or healthcare. Students must identify relevant knowledge areas, work collaboratively across disciplines, and reflect on both process and outcome. Faculty report that this structure promotes holistic thinking, resilience, and a sense of professional identity early on the students’ journeys (Kolmos et al. 2008).
On the undergraduate level, capstones are a common part of engineering education which happens at the late stages of the student’s studies. At Rowan University (New Jersey, USA), Engineering Clinics provide a different but equally powerful model. Students work across all four years on interdisciplinary teams, contributing to faculty research or industry-sponsored projects. These clinics are embedded in the curriculum and require students to engage deeply with current research problems, often involving complex technical and human systems. A junior clinic project, for example, might involve the optimisation of a renewable energy system integrating mechanical, electrical, and computer engineering principles. Therefore, students learn to navigate ambiguity, collaborate with experts, and see the relevance of their disciplinary knowledge in a broader context by confronting the messy nature of real data.
These are two of many examples where systems thinking is cultivated. Students gain exposure to open-ended problems and practice seeking connection across domains as they encounter the limits of their knowledge. In this fast-moving era, crossing disciplines empowers students for lifelong adaptation, allowing them to incorporate their experiences into any new technological developments. It also encourages treating learning as a collaborative social process, rather than a solo race to secure the first job.
Educators must do more than just deliver content; they also need to act as facilitators and learn alongside their students. By redesigning the curriculum around design-oriented problems that mirror real-world changes, higher education will better prepare future engineers to face upcoming systemic global challenges.
Looking ahead:
As artificial intelligence and automation continue to reshape industry, engineering education must also evolve. Integrating complex systems into teaching offers students the opportunity to engage directly with the data-driven ecosystem they will encounter in practice. The goal is not only to produce technically skilled engineers, but also thoughtful stewards of technology who can navigate its broader social and ethical dimensions.
One ongoing challenge is that independent projects often vary in quality and can be difficult to assess. Without intentional design, students may default to trial-and-error approaches instead of drawing on knowledge from prior courses. At the same time, the pressure to cover extensive technical material can make it difficult to provide the broader systems context essential for modern engineering. Yet when learning is reinforced across the curriculum, students are better prepared for future careers that demand systems-based thinking.
Experiential, self-directed projects play a crucial role in this preparation. They allow students to choose their own path while working closely with advisors and industry partners. Whether developing a product, designing a system, or engaging with professionals, students gain a perspective that feels different from traditional coursework. This process offers them a glimpse of what it means to think and act like real engineers, fostering both confidence and adaptability as they transition from the classroom to the workplace.
References:
Jakobsson, Eric et al. (1999) ‘Complex systems: Why and what?’, New England Complex Systems Institute. Available at: https://necsi.edu/complex-systems-why-and-what (Accessed: 16 July 2025).
Stegeager, N., Traulsen, S., Carvalho Guerra, A., Telléus, P., Du, X. (2024) ‘Do good intentions lead to expected outcomes? Professional learning amongst early career academics in a problem-based program’, Education Sciences, 14(2), p. 205. Available at: https://doi.org/10.3390/educsci14020205.
Tauro, F., Cha, Y., Rahim, F., Rasul, M.S., Osman, K., Halim, L., Dennisur, D., Esner, B., Porfiri, M. (2017) ‘Integrating mechatronics in project-based learning of Malaysian high school students and teachers’, International Journal of Mechanical Engineering Education. Available at: https://journals.sagepub.com/doi/full/10.1177/0306419017708636 (Accessed: 1 August 2025).
Watters, J., Pillay, H. and Flynn, M. (2016) ‘Industry-school partnerships: A strategy to enhance education and training opportunities. Australia’, Queensland University of Technology. Available at: https://eprints.qut.edu.au/98390/ (Accessed: 30 July 2025).
Any views, thoughts, and opinions expressed herein are solely that of the author(s) and do not necessarily reflect the views, opinions, policies, or position of the Engineering Professors’ Council or the Toolkit sponsors and supporters.
Keywords: Artificial Intelligence; Large Language Model; Sociotechnical systems; Ethics; Modelling or simulation; Emergence.
Licensing:This work is licensed under a Creative Commons Attribution-ShareAlike 4.0 International License. It is based upon the author’s article “Enhancing Ethical Reasoning in Engineering Education through Student-Created Interactive Ethical Scenarios Using Generative AI,” 2025 IEEE Global Engineering Education Conference (EDUCON), London, United Kingdom, 2025, pp. 1-5, doi: 10.1109/EDUCON62633.2025.11016531.
Related INCOSE Competencies: Toolkit resources are designed to be applicable to any engineering discipline, but educators might find it useful to understand their alignment to competencies outlined by the International Council on Systems Engineering (INCOSE). The INCOSE Competency Framework provides a set of 37 competencies for Systems Engineering within a tailorable framework that provides guidance for practitioners and stakeholders to identify knowledge, skills, abilities and behaviours crucial to Systems Engineering effectiveness. A free spreadsheet version of the framework can be downloaded.
This resource relates to the Systems Thinking, Life Cycle, Configuration Management, Requirements Definition, Verification, and Validation INCOSE Competencies.
AHEP mapping: This resource addresses several of the themes from the UK’s Accreditation of Higher Education Programmes fourth edition (AHEP4): Analytical Tools and Techniques (critical to the ability to model and solve problems), and Integrated / Systems Approach (essential to the solution of broadly-defined problems). In addition, this resource addresses AHEP themes of Ethics and Communication.
Debug their simulation through playtesting, documenting issue → fix → retest cycles and demonstrating how changes improve coherence.
Explore trade-offs and justify decisions in ethics (e.g. consequences and equity) and complex systems (e.g. resilience vs cost vs emissions).
Evidence learning with transparent artefacts: initial prompt, changes via tracked changes or before/after snippets, tester feedback, and final prompt.
Reflect critically on validity, bias and the limitations of LLMs as simulators, including how to handle unsafe/poor choices by surfacing realistic consequences.
Communicate findings clearly to technical and nontechnical audiences.
Teachers have the opportunity to:
Use this as either a studio activity (3–5 sessions) or a compact assessment only task (1–2 sessions), with clear rubrics for each.
Standardise scope by offering a predefined scenario (e.g., Urban Heatwave Response, UK city), or permit student proposed topics.
Scale marking via artefact based evidence (prompt, change log, feedback, final prompt) rather than long reports.
Deliver with institutional Microsoft Copilot licences or any free web LLM; require students to disclose model and version used.
Adapt quickly to different disciplines by swapping the scenario pack (microgrids, water networks, medical device supply chains, etc.).
Overview:
This resource enables engineering students to create, run, and debug a text‑based, interactive simulation of a complex sociotechnical system using a Large Language Model (LLM). It is intentionally flexible and may be delivered as a multi‑session studio activity (including assessment) or used solely as a compact assessment.
Purpose and use:
In both modes, students design a robust text prompt, test it with a user, document changes, and submit auditable artefacts that evidence learning. The key activity is interrogating their own thinking on how complex systems should be modelled by making judgements as to how their game does and does not capture the system dynamics.
The submission is a text LLM prompt with tracked changes, which allows students to demonstrate system design and debugging, produce transparent process evidence, and scale to large cohorts with minimal infrastructure.
Delivery options at a glance:
Audience
Undergraduate Years 2–4 and taught MSc, any engineering discipline
Modes
Studio activity (3–5×2 h + independent study) or Assessment‑only (prompt‑only; 1–2×2 h + 4–6 h)
Teams
3–4 students (solo permitted for assessment‑only)
Assessment
Portfolio (studio) or prompt‑plus‑change‑log (assessment‑only)
Platforms
Institutional Copilot licences successful; encourage exploration of free tools (students record model/version)
Materials and software:
LLM access: institutional Microsoft Copilot licences (proven) or any reputable free web‑based tool. Students disclose the model and version.
Delivery modes:
Mode A — Studio activity (3–5 sessions)
Session 1: Frame the system — boundary, stakeholders, conflicting goals; sketch a Causal Loop Diagram (CLD) with at least two reinforcing and two balancing loops.
Session 2: Make it playable — define 4–8 state variables and KPIs; draft the prompt (based on Appendix A); specify commands, turn length and stop conditions; add debug controls (`trace`, `why`, `show variables`, `revert`).
Between sessions: Prototype v1 — run 10–15 turns; capture a transcript; log defects (e.g. inconsistent updates, missing delays, moralising responses).
Session 3: Play‑test and iterate — exchange prototypes across teams or test with an external user; record issue → fix → re‑test cycles with evidence (make sure edits are captured in tracked changes).
Session 4: Present and reflect — short demo (6–8 turns); explain how feedback/delays manifest; discuss surprises and limits.
Mode B — Assessment‑only (prompt‑only; 1–2 sessions)
Session 1: Brief and rapid scoping — select a scenario (student‑chosen or predefined); write a one‑paragraph boundary and stakeholders note; draft the initial prompt (based on Appendix A) with role choices, 4–6 state variables, simple commands, and a 12–15 turn cap.
Independent work: Debugging loop — run the prompt; identify faults; edit the prompt (make sure edits are captured in tracked changes); re‑run and capture short snippets demonstrating fixes; test with one peer and collect written feedback.
Session 2: Submission — students submit a single document with the initial prompt, change log (before/after snippets), tester feedback, the final prompt, and a short rationale of innovative choices.
In both modes, module leaders may supply a predefined scenario(s) to standardise scope and simplify marking. A ready‑to‑use example is provided in Appendix C.
Critical medical device supply chain — redundancy vs cost; equitable allocation.
Appendix A — Prompt template (simulation + debug‑ready):
Title: Complex Systems Simulator — [Scenario]
Purpose: Run a turn‑based interactive simulation of a complex sociotechnical system. Track named state variables, apply feedback and delays, and let the player’s decisions drive non‑linear outcomes.
Setup:
1) Offer three roles (distinct authority/constraints).
2) Introduce 3–5 NPCs with clear goals and plausible interventions.
3) Show a dashboard of [STATE_VARIABLES] each turn with short context.
State rules:
Track only these variables (with units/ranges): [list 5–8].
Maintain at least two feedback loops and one delay; keep hidden rule notes consistent across turns.
Each turn: recap; propose 3–5 options (plus free‑text); explain updates; show dashboard; request the following action.
Time step: 5 minutes to 1 week; end after 20–30 turns or on stop conditions.
Commands: status, talk [npc], inspect [asset], implement [policy], pilot [intervention], advance time, review log.
Debug commands (for testing): trace on/off (print update logic), why (state which loops/delays drove the change), show variables (print current state table), revert (roll back one turn), reseed (slight exogenous shock).
Realism and ethics: Allow all plausible actions and report consequences neutrally. If unsafe in the real world, refuse, propose safer alternatives, and continue with plausible systemic effects.
LLM pitfalls to avoid: Do not invent new variables; ask clarifying questions rather than guessing; keep outputs concise; summarise trajectory every five turns.
Begin: Greet the player, state the scenario, ask for a role, and wait.
Appendix B — Debugging and play‑test checklist:
Functional coherence
Do state variables update consistently with declared logic?
Are reinforcing and balancing feedback identifiable in play?
Robustness
Does the simulation permit negative choices with realistic consequences?
Do trace/why explanations match outcomes?
Are stop conditions respected?
User experience and clarity
Are commands clear? Is turn pacing appropriate?
Are dashboards concise and informative?
Report
Provide three concrete defects with turn numbers, the prompt edits that fixed them, and evidence of the re‑run.
Appendix C — Predefined scenario (Urban Heatwave Response, UK city):
Boundary: One UK local authority area during the July–August heatwave period. Focus on public health, energy demand, and community resilience.
Roles: (1) Local Authority Resilience Lead; (2) NHS Trust Capacity Manager; (3) Distribution Network Operator (DNO) Duty Engineer.
Stakeholders: Residents (with a focus on vulnerable groups), care homes, schools, SMEs, DNO, local NHS Trust, emergency services, voluntary/community groups, Met Office (for alerts), and local media.
State variables (examples): Heat‑health alert level (0–4); Emergency Department occupancy (%); Electricity demand/capacity (% of peak); Indoor temperature exceedance hours (hrs > 27 °C); Public trust (0–100); Budget (£); Equity index (0–100).
Events/shocks: Red heat alert; substation fault; procurement delay; misinformation spike on social media; transport disruption; community centre cooling failure.
KPIs and stop conditions: Heat‑related admissions; unserved energy; cost variance; equity gap across wards. Stop if alert level 4 persists >3 days, budget overspends >10%, or trust <25.
Notes for assessors: Using a standard, predefined scenario simplifies marking and ensures comparable complexity across teams, while still allowing for diverse strategies and outcomes.
Any views, thoughts, and opinions expressed herein are solely that of the author(s) and do not necessarily reflect the views, opinions, policies, or position of the Engineering Professors’ Council or the Toolkit sponsors and supporters.
Related INCOSE Competencies: Toolkit resources are designed to be applicable to any engineering discipline, but educators might find it useful to understand their alignment to competencies outlined by the International Council on Systems Engineering (INCOSE). The INCOSE Competency Framework provides a set of 37 competencies for Systems Engineering within a tailorable framework that provides guidance for practitioners and stakeholders to identify knowledge, skills, abilities and behaviours crucial to Systems Engineering effectiveness. A free spreadsheet version of the framework can be downloaded.
This resource relates to the Systems Thinking, Systems Modelling and Analysis, Ethics and Professionalism, Technical Leadership and Critical Thinking INCOSE Competencies.
AHEP4 mapping: This resource addresses several of the themes from the UK’s Accreditation of Higher Education Programmes fourth edition (AHEP4): Analytical Tools and Techniques (critical to the ability to model and solve problems), and Integrated / Systems Approach (essential to the solution of broadly-defined problems). In addition, this resource addressesAHEP themes of Design, Ethics and Communication.
Educational level: Intermediate; Advanced.
Learning and teaching notes:
The case is built around 3 × 90-minute sessions and independent report writing. A suggested breakdown of the activities can be seen below.
Learners have the opportunity to:
Explore how technical, human, and organisational factors interact in complex socio-technical systems.
Apply Fault Tree Analysis (FTA) to diagnose ambiguous real-world engineering failures.
Practice making judgements under uncertainty with incomplete and conflicting data.
Analyse competing stakeholder perspectives and the ethical trade-offs in engineering decision-making.
Develop professional communication skills by producing expert reports and presenting findings to a stakeholder panel.
Reflect on their own reasoning, assumptions, and handling of complexity.
Teachers have the opportunity to:
Use an authentic, narrative-driven case to introduce systems thinking and failure analysis.
Facilitate active learning through group FTA construction and peer review.
Engage students in interdisciplinary learning that links materials science, engineering practice, regulation, and ethics.
Adapt the complexity of the case (technical vs organisational) depending on learners’ level and course focus.
Provide formative and summative assessment using expert reports, presentations, and reflective writing.
Encourage metacognitive development by prompting students to examine uncertainty and assumptions in engineering practice.
20 min: Introduce case scenario and system context; 30 min: Group discussion on initial impressions, key stakeholders, and potential causes; 40 min: Begin Fault Tree Analysis (FTA) construction using initial evidence.
2
Investigation and analysis
30 min: Continue FTA construction and data evaluation; 30 min: Peer review of other groups’ fault trees; 30 min: Consolidate findings and prepare draft report outline.
3
Reporting and reflection
30 min: Present findings to a simulated stakeholder panel; 30 min: Discuss feedback and defend conclusions; 30 min: Individual reflection on complexity, uncertainty, and assumptions.
Summary of the system or context:
Rail transport systems consist of thousands of interdependent components, including rails, fasteners, sleepers, signalling systems, and maintenance processes. Failures in a single component can cascade, affecting:
Safety: Malfunctions may cause derailments or delays.
Economics: Service interruptions lead to financial losses and reputational damage.
Public trust: Media scrutiny increases scrutiny of operational practices.
On a cold January morning, a commuter train was halted after inspectors discovered a fractured rail joint component. Services were disrupted for several hours, stranding thousands of passengers. The media quickly picked up the story, raising questions about safety and reliability.
The rail operator urgently commissioned an engineering consultancy (the students) to investigate the failure. Their findings will inform both the safety authority’s decision on whether the line can reopen and the legal proceedings to determine liability.
The dilemma:
The operator demands a rapid report to resume services.
The manufacturer insists the component was produced to specification and blames poor maintenance.
The regulator requires an unbiased, defensible technical opinion before approving operations.
The public expects transparency and reassurance about safety.
As consultants, students face incomplete evidence: some lab tests are missing, inspection logs are inconsistent, and eyewitness accounts conflict. They must use Fault Tree Analysis (FTA) to map possible causes, evaluate data, and produce an expert opinion report — knowing that their conclusions could influence legal outcomes and public safety decisions.
Groups: 3–5 students per group; 3-4 groups can run in parallel.
Materials required: case narrative handouts, sample inspection log, example FTA, whiteboards/flipcharts, sticky notes for FTA mapping.
Activity flow:
1. Introduce case and assign roles.
2. Construct initial fault trees using evidence.
3. Peer-review across groups.
4. Draft expert report and present to simulated stakeholder panel.
5. Individual reflection on complexity and uncertainty.
Why use Fault Tree Analysis (FTA):
FTA is a structured approach to trace a failure from an observed event back to potential causes, including technical, human, and organisational factors.
FTA is particularly suitable for this case because it allows students to structure complex, uncertain information in a logical and transparent way. It helps them trace the chain of causes behind the rail component failure, linking material, human, and organisational factors into one coherent framework. By visualising how small events combine into system-level failures, FTA encourages learners to think critically about interdependencies, data gaps, and assumptions. It also mirrors real-world engineering investigations, where professionals must justify conclusions under uncertainty and demonstrate clear reasoning to stakeholders such as regulators or courts.
Visualises cause-effect relationships, interdependencies, and failure paths.
Encourages discussion of assumptions and uncertainties.
Questions and activities:
Discussion prompts:
Prompt
Expected insight / reflection
What technical, human, and organisational factors might have contributed to this failure?
Students identify multiple interacting factors, illustrating interdependencies and emergent risks.
How does Fault Tree Analysis help structure uncertainty in this investigation?
Learners recognise FTA’s role in visualising cause-effect pathways and clarifying assumptions.
Which assumptions are you forced to make, and how might they affect your conclusions?
Students reflect on data gaps, biased observations, and ethical implications of assumptions.
How do different stakeholders’ interests shape urgency and framing of your analysis?
Learners understand trade-offs, pressures from conflicting priorities, and the precautionary principle.
What are the risks of issuing a preliminary report under time pressure?
Students explore implications for safety, liability, professional integrity, and public trust.
Classroomactivities:
Activity
Focus
What “good practice” looks like
Facilitator notes / tips
1. FTA construction
Collaborative problem analysis
Teams discuss evidence openly, question assumptions, and co-create a logical tree linking technical, human, and organisational causes.
Encourage each group to identify at least one “human/organisational” branch and to label any data gaps explicitly.
2. Peer review
Critical reflection and systems perspective
Groups provide constructive critique, highlighting hidden assumptions, missing branches, or unclear logic. Dialogue stays professional and evidence-based.
Provide coloured sticky notes or digital comments to record feedback; model how to frame critique as questions (“Have you considered…?”).
3. Report writing (in-class drafting)
Synthesis and professional communication
Drafts show a clear, defensible reasoning chain from evidence to conclusion. Teams justify assumptions and note uncertainties.
Remind students to separate “facts” from “interpretations.” Encourage use of structured headings (Findings – Analysis – Conclusions).
4. Simulation role-Play
Perspective-taking and communication under pressure
Presentations are concise (≤5 min), factual, and adapted to stakeholder roles. Learners respond respectfully and clearly to challenging questions.
Provide role cards for the panel (operator, regulator, manufacturer, public). Rotate students if possible.
5. Reflection
Metacognition and learning from uncertainty
Students identify what surprised them, what they found ambiguous, and how their view of engineering judgment evolved.
Offer prompts like “What would you do differently next time?” or “Where did your reasoning feel uncertain?”
Further challenge:
Instructors may choose to introduce a second “reveal” phase: a new metallurgical test result or a whistle-blower statement emerges halfway through the case. Students must revise their fault tree and defend whether and how their conclusions change. This highlights the evolving nature of complex systems investigations.
Assessment opportunities:
Fault Tree Diagram (30%) – accuracy, depth, clarity.
Presentation and defence (20%) – clarity, stakeholder awareness, handling questions.
Reflective summary (20%) – insight into uncertainty, assumptions, systems thinking.
Any views, thoughts, and opinions expressed herein are solely that of the author(s) and do not necessarily reflect the views, opinions, policies, or position of the Engineering Professors’ Council or the Toolkit sponsors and supporters.