Peter Martin, Director of Research & Development at Quanser, and co-chair of the Complex Systems Toolkit Working Group, reflects on the importance of engineers understanding complex systems when working in the field of intelligent robotics.
“In late 2024 I had the opportunity to join the EPC Complex Systems Toolkit team as co-chair of the working group. At the time I felt a little fraudulent, as the intricacies of complex systems thinking was new to me. I had brushed up against complex systems numerous times over the years as I had studied and worked in the world of robotics for over 20 years. However, I had never discovered the world of formal complex systems analysis. Looking back, this is a perfect validation for the need to create a toolkit to better prepare students for careers like mine. As I have learned more over the last 18 months about the tools and techniques that systems engineers employ to model and manage complexity, the critical value that these techniques offer engineers in the world of intelligent robotics has become obvious. As we hear often in the field of engineering lab equipment for the academic space, “I wish I’d had this when I was at university”.
The other reassuring aspect of my experience, for me, is that I’m not alone. A growing need for better approaches to managing complexity has emerged in industry over the last couple of decades as robotics and their governing systems have become increasingly integrated into society. This transition of robotics out of the structured environment of the factory floor and into direct contact with both the dynamic and unstructured world and the public, has introduced a high degree of non-linear predictability, complex interactions with multiple robotic agents, and emergent behaviours as the decision-making algorithms that dictate robotic behaviour adapt. All of these elements are central to the world of complex systems analysis.
At a high level, modern robotics systems no longer represent technical engineering challenges in the narrow, discipline-specific sense that engineers would traditionally have seen in higher education. They are complex adaptive systems that routinely demonstrate behaviours that emerge from interactions with their environment rather than being fully specified in advance. A robot navigating a hospital corridor, a swarm coordinating warehouse logistics, or a surgical assistant adjusting in real time to tissue variability represent challenges in undefined, non-linear, and largely unpredictable spaces. Students, and later robotics engineers who lack a complex systems vocabulary are essentially tasked with trying to understand emergence without the tools to describe it.
An example that I like to use is one that we encountered a couple of years ago: a team of mobile robots transporting parts around a manufacturing space. In many cases, the agents (ground robots, arms, etc.) in this scenario are programmed with independent control and decision-making code to govern their behaviour, with some overarching supervisory code to manage tasks and assignments. The ground robots would have algorithms to localise, path plan, navigate, and avoid obstacles while communicating with other complementary agents and central task management. However, as I have learned, complexity lies in the emergence of unexpected interactions between the agents and their environment. How they avoid each other and the environment while achieving their tasks is largely a complex non-linear system where conflicts can routinely delay or disrupt their operation. Introducing more sources of disruption such as humans, unstructured environments, weather conditions etc. only makes dealing with unpredictable scenarios more and more complicated using traditional techniques.
Luckily, many of the tools and techniques that are highlighted in the toolkit have direct applications to the challenges faced by engineers in the world of robotics. Causal Loop Diagrams (CLDs) are an excellent way to model the feedback dynamics that are at play in adaptive control systems. When a robot’s perception system updates its world model based on changes in what the sensors can perceive, that leads to changes in its action policy that when executed create a feedback loop. These diagrams are a great way to visualise and analyse these loops. Agent-Based Modelling (ABM) is directly relevant to the scenario I described above where swarms of robot must be coordinated or manage human-robot interaction scenarios. Using these simulation tools, engineers can test and manage emergent fleet behaviour without hardware. If things do go sideways, Fault Tree Analysis is a common approach to mapping causes and evaluating data to help develop robots that work in safety-critical applications. Finally, for long-term operations such as field robotics missions, Systems Dynamics Modelling can be a useful tool for predicting and managing a robot’s resource consumption (battery, compute, bandwidth) depending on the required task performance over time.
In addition to these considerations, there is a whole world of network modelling and the management of behaviour stemming from machine learning and applied AI algorithms that also overlaps quite closely with complex systems. Engineers that understand emergence, feedback loops, and attractors are far better equipped to reason about why a robot does something unexpected, than students who only have a component-driven technical understanding of the behaviour of an intelligent robot. Beyond the decisions, at an actual component level there are critical decisions that need to be made for efficient deployment of physical and edge AI algorithms. What data is processed locally and what goes to the cloud, when models are updated and how decision making is distributed across a robot swarm are exactly the kind of questions that systems thinking trains engineers to answer. Systems tools are ready to help, including influence diagrams to manage information exchange and action planning.
Overall, the field of complex systems introduces a set of tools, techniques, and mental models that are increasingly essential to robotics engineers that seek to prepare their agents to be effective in performing complicated tasks in increasingly complex systems.”
Intelligent robotics, and the more recent applications to physical AI, generally refers to artificial intelligence systems that are embedded in and interact directly with the physical world, rather than operating purely in digital environments. For engineering students, learning about intelligent robotics and physical AI workflows matters because it sits at the intersection of software, hardware, and real-world problem solving. It helps engineers think holistically: not just “does the code work?” but “does the system behave safely and effectively in the real world?”.
We are seeking experts in intelligent robotics, from academia, industry, and engineering organisations, to develop resources on this topic for publication in the Toolkit. These resources will inform, guide and aid educators to embed teaching on intelligent robotics into their engineering lessons, modules or courses.
Any views, thoughts, and opinions expressed herein are solely that of the author(s) and do not necessarily reflect the views, opinions, policies, or position of the Engineering Professors’ Council or the Toolkit sponsors and supporters.
Downloads: A PDF of this resource will be available soon.
Related INCOSE Competencies: Toolkit resources are designed to be applicable to any engineering discipline, but educators might find it useful to understand their alignment to competencies outlined by the International Council on Systems Engineering (INCOSE). The INCOSE Competency Framework provides a set of 37 competencies for Systems Engineering within a tailorable framework that provides guidance for practitioners and stakeholders to identify knowledge, skills, abilities and behaviours crucial to Systems Engineering effectiveness. A free spreadsheet version of the framework can be downloaded.
AHEP4 mapping:This resource addresses several of the themes from the UK’s Accreditation of Higher Education Programmes fourth edition (AHEP4): Analytical Tools and Techniques (critical to the ability to model and solve problems), and Integrated / Systems Approach (essential to the solution of broadly-defined problems).
Educational level: Intermediate; Advanced.
Learners have the opportunity to:
Apply systems engineering principles to understand interdependencies between design, manufacturing, and performance.
Use CAD software (e.g. Autodesk Fusion 360) to model and iterate heat sink designs for additive manufacturing.
Explore simulation tools such as Thermal Analysis (Fusion 360) for predicting performance before fabrication.
Engage in design–build–test cycles, fabricating prototypes using metal additive manufacturing and evaluating them experimentally.
Collect and analyse real-time data using LabVIEW and data acquisition systems, linking digital design to physical performance.
Develop collaborative and communication skills through team-based design projects and peer review sessions.
Reflect on sustainability considerations in advanced manufacturing processes.
Teachers have the opportunity to:
Introduce students to complex systems thinking through practical, problem-based, experiential learning activities.
Demonstrate the integration of digital tools and physical testing in a closed-loop design process.
Guide learners in using industry-standard software for design and simulation, reinforcing professional practice.
Facilitate iterative design processes, encouraging students to analyse trade-offs and optimise performance.
Incorporate structured prompts, rubrics, and feedback mechanisms to support critical thinking and design evaluation.
Promote reflection and uncertainty management as part of assessment, linking technical outcomes to systemic insights.
Align activities with INCOSE competencies and AHEP4 themes, ensuring relevance to accreditation and professional standards.
Foster peer learning and collaboration through group work and discussion-based sessions.
Materials and tools required:
This activity utilises both computational design tools and an experimental thermal testing facility to establish a complete system feedback loop:
CAD software (Autodesk Fusion 360) for 3D modelling and design iteration.
Additive manufacturing equipment (metal 3D printer) for prototype fabrication.
Thermal Analysis Tool (Fusion 360) or other CFD simulation software (optional – for design simulation).
Data acquisition system and testing equipment.
The experimental facility integrates the following components:
K-type thermocouples calibrated to ASTM E230 (0–100°C, ±1°C).
Data Acquisition System: NI USB-6210 with custom LabVIEW interface.
Thermal paste: DOWSIL 340 for improved thermal contact.
Computer interface for real-time data recording and analysis.
Learning and teaching resources:
Pre-reading includes literature on additive manufacturing, design for manufacture, and systems thinking in engineering. Students can review the references listed below to learn the fundamentals of heat sinks, guidance on heat sink design, and important considerations.
This teaching activity introduces students to complex systems thinking by having them design, fabricate, and experimentally evaluate additively manufactured heat sinks. It can form part of an advanced manufacturing module, in which learners apply systems engineering principles to understand the interdependencies among design, manufacturing, and performance. The activity demonstrates how complex systems principles—such as feedback, emergence, and uncertainty—manifest in physical engineering systems. Students are guided to see the design–test–evaluate cycle as an iterative, data-driven process that links digital design environments with real-world performance outcomes.
Activity description:
The experiential learning activity links digital design, manufacturing, and physical evaluation using a complex systems framework. Students iterate designs, fabricate prototypes, and measure thermal performance, reflecting on interdependencies and feedback loops.
Session 1: Introduction:
Students are introduced to complex systems and additive manufacturing principles. Variables affecting heat sink performance – geometry, material, surface finish – are identified. The session frames these variables as part of an interconnected thermal management system.
Notes for educators:
Discuss the role of thermal management in high-performance systems.
Provide resources (journal articles, books) for further reading.
Map out factors affecting heat sink efficiency and their systemic relationships, along with the limitations in additive manufacturing.
Introduce complex design thinking concepts, including feedback loops, trade-offs, and uncertainty.
Provide an overview of digital tools (e.g. CAD and simulation software) that support iterative design.
Session 2*: Design and manufacture:
Teams create CAD models in Fusion 360 and prepare designs for metal additive manufacturing. Students analyse trade-offs between thermal performance, printability, and material efficiency, applying complex design thinking to balance competing requirements. Feedback from earlier simulations informs iterative design refinement.
Notes for educators:
Prerequisite knowledge:
Students are expected to be familiar with additive manufacturing processes, including basic 3D printing principles and design-for-manufacture considerations. This ensures that the session focuses on systems thinking and optimisation rather than on manufacturing fundamentals.
Provide design constraints:
Clearly state the size limitations for the heat sink and the capacity of the metal 3D printer, including:
Maximum build volume (e.g. 100 mm × 100 mm × 50 mm).
Minimum wall thickness (e.g. 1.5 mm).
Minimum spacing between fins (e.g. 2 mm).
Provide a design prompt (e.g. “Optimise heat sink geometry for maximum heat dissipation under given constraints”).
Share an evaluation rubric that assesses the following: design rationale, manufacturability, thermal performance, and discussion/reflection, including consideration of environmental and societal impacts.
Encourage peer-review sessions in which teams critique one another’s designs before fabrication.
*Advanced option:
Academics may incorporate Thermal Analysis Tools within Fusion 360 or CFD simulations (e.g. ANSYS Fluent) to evaluate design performance and refine heat sink geometry for optimal efficiency.
Session 3: Experimental set-up and evaluation:
Each prototype is tested using the dedicated testing facility, as shown in Figure 1.
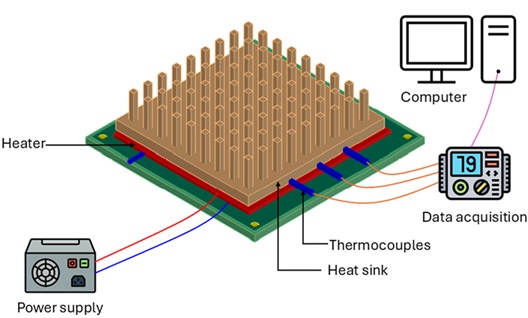
Figure 1: Schematic of the experimental facility for heat sink testing.
The experimental set-up used for evaluating the heat sink performance consists of a DC power supply (i.e. Velleman LABPS3003 30V, 3A), a polyimide-insulated flexible heater (i.e. OMEGA KHLVA-202/40), thermocouples (i.e. K type), a data acquisition system (i.e. NI USB-6210), and a computer for data recording, as shown schematically in Figure 1. A flexible heater is mounted beneath the heat sink, powered by a DC supply to simulate heat generation in microprocessors. Thermocouples are positioned at the heat sink base and calibrated to ASTM E230. A DOWSIL 340 thermal paste layer ensures optimal thermal contact. This enables accurate measurement of the thermal performance of fabricated heat sinks under controlled heat flux conditions.
Session 4: Data analysis and comparison:
A custom LabVIEW interface is developed to acquire, visualise, and log temperature and power data in real time, thereby providing a digital bridge between the physical test rig and the data analysis environment. Temperature and power data are acquired using LabVIEW with the NI USB-6210 DAQ card.
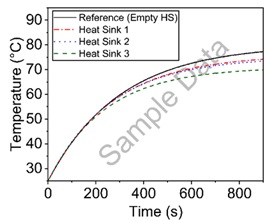
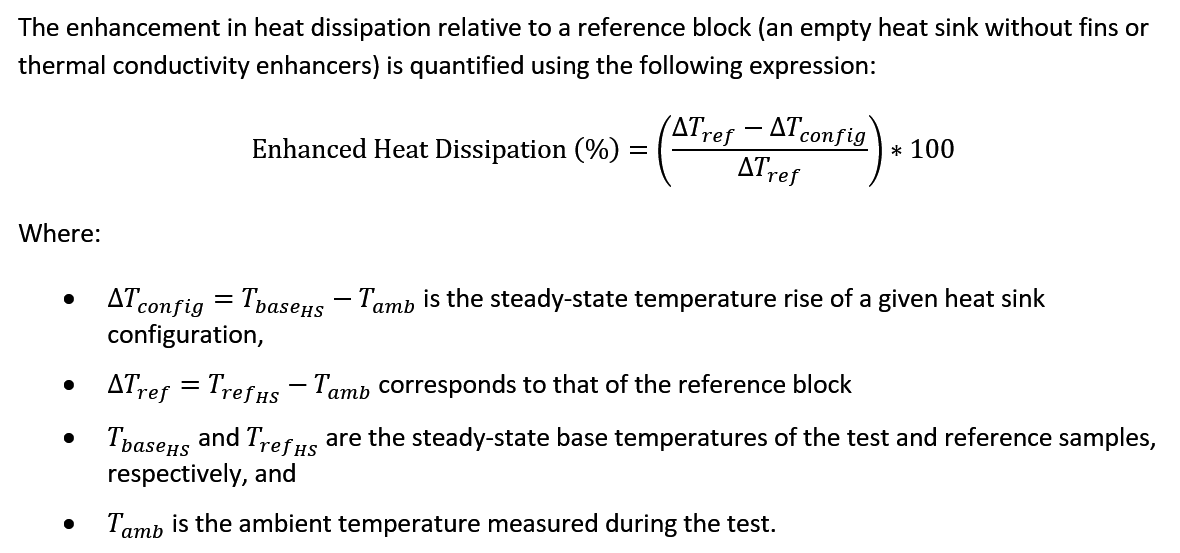
The evaluation and comparison of thermal performance among heat sink geometries designed by various student groups are conducted by recording the base temperature of each configuration as a function of time under a constant heat flux and identical ambient conditions. The transient temperature response, illustrated in Figure 2 (a), provides insight into the rate at which each design approaches steady state, whereas the steady-state base temperature indicates its overall heat dissipation capability. This procedure can be applied to any heat sink to assess and compare its thermal behaviour.
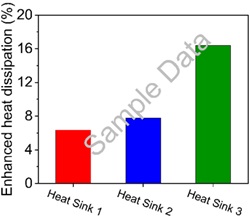
Figure 2: (a) Transient base temperature variation with time for the reference and three heat sink configurations. (b) Enhanced heat dissipation relative to the reference block, illustrating the method used to compare thermal performance across different designs.
Students compare results and interpret the impact of geometry on heat dissipation. They connect observed variations to systemic dependencies between design, manufacture, and experimental performance.
The computed enhancement values, shown in Figure 2 (b) allow direct comparison of heat dissipation efficiency among the different designs. By examining both the temperature–time response and the enhancement ratio, the effect of geometric modification on thermal performance can be quantitatively assessed within a unified experimental framework.
The experimental facility thus forms a closed digital loop connecting design, fabrication, and performance evaluation. The data acquired through LabVIEW and the DAQ system feed back into the design process, enabling iterative optimisation of heat-sink geometry and thermal-management strategies.
Session 5: Reflection:
Teams map out interdependencies between process variables, performance metrics, and uncertainties. They construct feedback diagrams (flowcharts) using Microsoft PowerPoint SmartArt, linking design iterations, measurements, and outcomes to identify emergent system behaviour.
Assessment and reflection:
The assessment can comprise a reflective report and a presentation.
Reports should include:
Interpretation of experimental data and comparison of thermal performance across designs.
Evaluation of system feedback mechanisms, showing how design decisions influenced outcomes.
Discussion of uncertainty management, including:
Identifying sources of uncertainty (e.g. measurement errors, material properties, environmental conditions).
Explaining how these uncertainties were considered during design iterations and testing.
Reflecting on strategies to mitigate uncertainty (e.g. calibration, repeated trials, simulation validation).
Considering the impact of uncertainty on decision-making and overall system performance.
Presentations should summarise:
The design evolution and rationale for changes.
System mapping to illustrate interdependencies and feedback loops.
Insights into complex systems behaviour, including how uncertainty shaped design choices.
Additional image:Heatsink fabricated using a metal 3D printer.
Any views, thoughts, and opinions expressed herein are solely that of the author(s) and do not necessarily reflect the views, opinions, policies, or position of the Engineering Professors’ Council or the Toolkit sponsors and supporters.
Downloads: A PDF of this resource will be available soon.
Related INCOSE Competencies: Toolkit resources are designed to be applicable to any engineering discipline, but educators might find it useful to understand their alignment to competencies outlined by the International Council on Systems Engineering (INCOSE). The INCOSE Competency Framework provides a set of 37 competencies for Systems Engineering within a tailorable framework that provides guidance for practitioners and stakeholders to identify knowledge, skills, abilities and behaviours crucial to Systems Engineering effectiveness. A free spreadsheet version of the framework can be downloaded.
This resource relates to the Systems Thinking, Systems Modelling and Analysis, Configuration Management, Requirements Definition, Communication, Verification, and Validation INCOSE Competencies.
AHEP4 mapping: This resource addresses several of the themes from the UK’s Accreditation of Higher Education Programmes fourth edition (AHEP4):Analytical Tools and Techniques (critical to the ability to model and solve problems), and Integrated / Systems Approach (essential to the solution of broadly-defined problems). In addition, this resource addresses the themes of Sustainability and Communication.
Educational level: Advanced.
Learning and teaching notes:
Overview:
This multi-part case study guides students through the complex systems challenges of Prince Edward Island, Canada’s ambitious 100% renewable energy transition by 2030. Students will experience how technical, social, and economic factors interact through emergence, feedback loops, and multi-scale dynamics that traditional engineering analysis alone cannot capture.
Learners have the opportunity to:
Identify complex systems characteristics (emergence, feedback loops, nonlinearity) in real energy systems.
Apply multiple modelling approaches (ABM, system dynamics, network analysis) to analyse system behaviour.
Evaluate how technical decisions create emergent social and economic consequences.
Synthesise insights from different modelling approaches to inform policy recommendations.
Communicate complex systems concepts and uncertainties to non-technical stakeholders.
Teachers have the opportunity to:
Demonstrate complex systems concepts through hands-on modelling.
Facilitate discussions on emergence and system-level behaviours.
Evaluate learners’ ability to apply systems thinking to engineering problems.
Connect technical modelling to real-world policy and social implications.
Overview: Energy transition as a complex systems challenge:
Prince Edward Island (PEI), Canada’s smallest province, aims to achieve 100% renewable electricity by 2030. Its small grid, dependence on imported power, and growing renewable infrastructure make it a natural laboratory for systems thinking in energy transitions.
This case invites students to explore how technical, social, and policy decisions interact to shape renewable integration outcomes. Using complexity-science tools, they will uncover how local actions produce emergent system behaviour, and why traditional linear models often fail to predict real-world dynamics.
The complex challenge: Traditional engineering approaches often treat energy systems as predictable and linear, optimising components like generation, transmission, or storage in isolation. However, energy transitions are complex socio-technical systems, characterised by feedback loops, interdependencies, and emergent behaviours.
In PEI’s case, replacing stable baseload imports with variable wind and solar generation creates cascading effects on grid stability, pricing, storage demand, and social acceptance. The island’s bounded geography magnifies these interactions, making it an ideal context to observe emergence and system-level behaviour arising from local interactions.
PEI currently imports about 75% of its electricity via two 180 MW submarine cables, while 25% is produced locally through onshore wind farms (204 MW). Plans for offshore wind, community solar, and hydrogen projects have triggered debates around stability, affordability, and social acceptance.
Taking on the role of an engineer at TechnoGrid Consulting, students are tasked to advise Maritime Electric, the island’s utility, on modelling strategies to guide $2.5 billion in renewable investments.
Competing goals:
Maintain grid reliability while replacing fossil baseloads.
Achieve policy targets without increasing public resistance.
Balance economic cost, environmental benefit, and technological feasibility.
Discussion prompt:
In systems terms, where do you see tensions between policy, technology, and society? How might feedback loops amplify or mitigate these tensions?
While Maritime Electric’s engineering team insists the project scope should stay strictly technical, limited to grid hardware, generation, and storage, policy advisors argue that social behaviour, market pricing, and community engagement are part of the system’s real dynamics.
Expanding boundaries makes the model richer but harder to manage; narrowing them simplifies computation but risks missing the very factors that determine success.
Temporal boundaries: timescales from milliseconds (grid response) to decades (infrastructure).
Organisational boundaries: stakeholders, regulations, and markets.
Discuss how including or excluding elements (e.g., electric-vehicle uptake, community cooperatives, carbon policy) changes the model’s focus and meaning.
Learning insight:
Complex systems cannot be fully understood in isolation; boundaries are analytical choices that shape both perception and leverage. Every inclusion or exclusion reflects an assumption about what matters and that assumption determines which complexities emerge, and which stay hidden.
Part three: Modelling the system: Multiple lenses of complexity:
(a) Agent-Based Modelling (ABM) with NetLogo:
Students construct simplified models of households, businesses, and grid operators:
Household agents: decide to adopt rooftop solar based on payback time and neighbour influence.
Technology providers: adjust prices in response to market demand.
Grid operator: balances reliability and cost.
Emergent patterns such as adoption S-curves or network clustering illustrate how simple local rules generate complex collective dynamics.
(b) System Dynamics (SD) with Vensim:
Students then develop causal loop diagrams capturing key feedbacks:
Adoption–Learning Loop: installations ↓ costs ↓ encourage more adoption.
Cost–Acceptance Loop: higher bills ↓ public support ↓ investment capacity.
This provides a macroscopic view of feedback, delay, and leverage points.
(c) Network Analysis with Python (NetworkX):
Students model actor interdependencies: how households, utilities, industries, and regulators interact. Network metrics (centrality, clustering, connectivity) reveal where resilience or vulnerability is concentrated.
Reflection prompt:
Which modelling approach offered the most insight into system-level behaviour? What were the trade-offs in complexity and interpretability?
Part four: Scenario exploration: Pathways to 2030:
Students explore three transition scenarios, each with distinct emergent behaviours:
A. Distributed Solar + Community Storage
300 MW solar, 150 MWh batteries
Decentralised coordination challenges and social clustering effects.
B. Offshore Wind + Grid Enhancement
400 MW offshore wind, new 300 MW interconnection
Weather-dependent reliability and cross-border dependency.
Any views, thoughts, and opinions expressed herein are solely that of the author(s) and do not necessarily reflect the views, opinions, policies, or position of the Engineering Professors’ Council or the Toolkit sponsors and supporters.
Downloads: A PDF of this resource will be available soon.
Who is this article for?: This article should be read by educators at all levels of higher education looking to highlight the connection between complex systems and sustainability within engineering learning.
Related INCOSE Competencies: Toolkit resources are designed to be applicable to any engineering discipline, but educators might find it useful to understand their alignment to competencies outlined by the International Council on Systems Engineering (INCOSE). The INCOSE Competency Framework provides a set of 37 competencies for Systems Engineering within a tailorable framework that provides guidance for practitioners and stakeholders to identify knowledge, skills, abilities and behaviours crucial to Systems Engineering effectiveness. A free spreadsheet version of the framework can be downloaded.
This resource relates to the Systems Thinking, Life Cycles, Capability Engineering, Systems Modelling and Analysis, and Design INCOSE competencies.
AHEP mapping: This resource addresses several of the themes from the UK’s Accreditation of Higher Education Programmes fourth edition (AHEP4): Analytical Tools and Techniques (critical to the ability to model and solve problems), and Integrated / Systems Approach(essential to the solution of broadly-defined problems). In addition, this resource addresses AHEP themes of Materials, equipment, technologies and processes, and Sustainability.
Several sustainability challenges, such as transitioning to a circular economy, are embedded in complex socio-technical systems. A circular economy is an economic model that replaces the linear take-make-dispose pattern with systems that keep materials and products in use for longer through designing for durability, reuse, remanufacturing, and recycling, while minimising waste and regenerating natural systems (Rizos, Tuokko, and Behrens, 2017).
Complex systems like these exhibit feedback loops, delays, non-linear change, path dependence and emergent behaviour (Sterman, 2000; Meadows, 2008). This article introduces the idea of systems-based interventions using the example of aluminium recycling systems. It is designed for engineering educators who plan to provide learners with a baseline understanding of complexity and practical entry points for designing and developing and evaluating interventions that can move a system towards sustainability.
Complexity of aluminium recycling systems:
Aluminium is infinitely recyclable, yet achieving truly closed material loops at scale remains a challenge. Most of today’s recycling occurs in situations where post-consumer scrap is collected from a wide variety of end-of-life products and the boundaries of the recycling system are difficult to define and control. This creates high variability in both the composition and the quality of recovered aluminium, since different products contain different alloys and levels of contamination (IRT M2P, 2023). At the same time, the volume of available scrap is difficult to predict, as it depends on product lifespans and consumer behaviour. These fluctuations make it harder for producers to plan and optimise secondary aluminium output, particularly when industries rely on consistent standards or just-in-time manufacturing.
The recycling system is also shaped by broader economic and regulatory forces. On the one hand, demand for low-carbon materials and the cost advantage of recycled over primary aluminium are powerful drivers of growth. On the other hand, the system faces constraints from volatile scrap prices and shifting global trade dynamics, such as U.S. tariffs on aluminium imports. Meanwhile, new policy instruments are adding further complexity. The EU’s Carbon Border Adjustment Mechanism (CBAM) is set to reshape trade flows and investment patterns, while the forthcoming Digital Product Passport (DPP) will transform how information is shared across the value chain. Together, these forces influence technologies, markets and business models, underscoring the dynamic and interconnected nature of aluminium recycling.
These interconnected factors highlight aluminium recycling as a complex socio-technical system, in which technological capabilities, market incentives, policy frameworks, and global trade are deeply interconnected. For educators, this makes aluminium an effective example for teaching students how multiple forces interact to create both opportunities and challenges for sustainable engineering.
Intervention from systems perspective:
System Dynamics (SD), first formalised byForrester (1968), has proven to be a highly valuable approach for understanding and managing complex resource and recovery systems. SD is an interdisciplinary approach, drawing on insights from psychology, organisational theory, economics, and related fields (Sterman, 2000). More supporting information about SD pedagogical tools and techniques can be found through the System Dynamics Society and Insight Maker.
From a systems perspective, interventions are not isolated events but strategic effort to influence system behaviour by targeting its structure and dynamics. A key concept here is leverage points – places within a complex system where small changes can lead to significant, systemic effects (Meadows, 1999). Meadows identified twelve types of leverage points, ranging from adjusting parameters to transforming the system’s underlying goals and paradigms, proving a conceptual framework for identifying impactful intervention.
Figure 1. Donella Meadows’ leverage points (Source: based on Meadows (1999); credit: UNDP/Carlotta Cataldi; reproduced fromBovarnick and Cooper (2021))
Exploration of potential leverage points:
System Dynamics (SD) tools such as Causal Loop Diagrams (CLDs) can help explore leverage points. CLDs can help visualise main components of a system and their interdependencies, making complex dynamics easier to understand. Besides, the process of building a CLD or more computational SD model encourages practitioners to clarify system boundaries, relationships, and drivers, laying the foundation for identifying leverage points.
For example, a CLD of aluminium recycling might capture how classification and sorting processes influence scrap quality, which then affects remelting efficiency and ultimately market uptake of recycled alloys (see Figure 2 below).
Figure 2. The causal loop diagram for auto aluminium recycling (Liu et al., 2025)
By tracing these circular cause-and-effect relationships, learners can see where interventions may ripple through the system. Highlighting reinforcing loops, balancing loops, and delays also shows why some interventions produce limited short-term results but more substantial long-term effects.
Leverage points can also be examined through the lens of information, rules, and goals. Improved information flows, such as those enabled by the Digital Product Passport, could reshape how scrap is sorted and valued. Rules, such as alloy specifications or trade tariffs, determine what types of recycled material can enter the market. At a deeper level, the goals of the system, whether to maximise throughput or to retain material value, fundamentally shape behaviour. Here too, CLDs are valuable because they allow users to visualise how changes to information, rules, or goals can shift system dynamics, providing a clearer picture of where interventions might be most effective.
Implication for educators:
This article equips educators with a focused, practical pathway to teach systems thinking through the example of aluminium recycling. Students can gain both conceptual understanding and hands-on skills to map feedback loops, identify delays, and design interventions that account for short-term trade-offs and long-term system behaviour. Teaching a single clear CLD followed by one modelling or scenario activity produces measurable learning gains while keeping the task accessible for beginners.
Educational approach:
Prioritise structure before solutions: have students map feedback loops and delays before proposing fixes.
Use one classroom-ready CLD as the anchor activity and one hands-on modelling task to test interventions.
Emphasise leverage thinking: move from parameter tweaks to information, rules, goals and paradigms as students mature.
Keep language simple and concrete: avoid jargon, introduce terms with examples, and reuse the same CLD across activities.
Use open-access tools (Insight Maker, Loopy, Vensim PLE) so students can visualise and experiment without software barriers.
Focus assessment on reasoning about system behaviour and predicted long-term effects rather than exact numerical answers.
Potential related learning outcomes within this topic:
Define stocks, flows, feedback loops, delays, reinforcing and balancing loops.
Explain why aluminium recycling is a complex socio-technical system influenced by technology, markets, policy, and information.
Construct a simple CLD for an aluminium recycling pathway and identify at least two reinforcing and one balancing loop.
Identify two leverage points and justify which one to prioritise, citing anticipated short- and long-term system effects.
Translate the CLD into a basic stock-and-flow sketch in an open-access tool and run one scenario to compare outcomes.
Further resources:
European Commission: Joint Research Centre, Environmental and socio-economic impacts of the circular economy transition in the EU cement and concrete sector – Analysing plastics material flows with life cycle-based and macroeconomic assessment models, Publications Office of the European Union, 2025, https://data.europa.eu/doi/10.2760/6579506
The Complexity and Interconnectedness of Circular Cities and the Circular Economy for Sustainability — analysis of research themes and networked interactions relevant for urban/material systems; useful for teaching complexity and cross-sector links. https://onlinelibrary.wiley.com/doi/pdf/10.1002/sd.2766
Bovarnick, A. and Cooper, S. (2021) “From what to how: rethinking food systems interventions,” Agriculture for Development. Edited by K. Hussein, 22 April, pp. 49–53.
Forrester, J.W. (1968) “Industrial Dynamics—After the First Decade,” Management Science, 14(7), pp. 398–415. Available at: https://doi.org/10.1287/mnsc.14.7.398.
Liu, M., Schneider, K., Litos, L., Salonitis, K., 2025. Enhancing Secondary Aluminium Supply: Optimising Urban Mining Through a Systems Thinking Approach, in: Edwards, L. (Ed.), Light Metals 2025. Springer Nature Switzerland, Cham, pp. 1273–1279.
Meadows, D.H. (1999) Leverage Points – Places to Intervene in a System, The Sustainability Institute.
Meadows, D.H. (2008) Thinking in systems: A primer. White River Junction, VT: Chelsea Green Publishing Company.
Sterman, J. (2000) “Business Dynamics, System Thinking and Modeling for a Complex World.” Available at: http://hdl.handle.net/1721.1/102741 (Accessed: September 4, 2025).
Any views, thoughts, and opinions expressed herein are solely that of the author(s) and do not necessarily reflect the views, opinions, policies, or position of the Engineering Professors’ Council or the Toolkit sponsors and supporters.
Who is this article for?: Thisarticle should be read by educators at all levels in higher education who are seeking an overall perspective on teaching approaches for integrating complex systems in engineering education.
Related INCOSE Competencies: Toolkit resources are designed to be applicable to any engineering discipline, but educators might find it useful to understand their alignment to competencies outlined by the International Council on Systems Engineering (INCOSE). The INCOSE Competency Framework provides a set of 37 competencies for Systems Engineering within a tailorable framework that provides guidance for practitioners and stakeholders to identify knowledge, skills, abilities and behaviours crucial to Systems Engineering effectiveness. A free spreadsheet version of the framework can be downloaded.
This resource relates to the Systems Thinking and Critical Thinking INCOSE competencies.
AHEP mapping: This resource addresses several of the themes from the UK’s Accreditation of Higher Education Programmes fourth edition (AHEP4): Analytical Tools and Techniques (critical to the ability to model and solve problems), and Integrated / Systems Approach (essential to the solution of broadly-defined problems).
Premise:
This document aims to provide definitions of key terms regarding engineered complex systems.
There are many existing relevant glossaries (for example, the Systems Engineering Body of Knowledge or SEBoK) so we have implemented a process to select a curated list of 14 common terms that are fundamental when considering the idea of complexity in engineered solutions, and therefore of importance to educators in this space. Rather than adding new definitions for each term we offer appropriate and accessible definitions from the literature, together with commentary exploring wider context and consideration where relevant.
Approach:
Some care is needed when using any definition around terms relating to complexity – because complexity itself is complex. There are multiple valid perspectives and so any one definition is unlikely to capture the totality of nuance and satisfy the variety of viewpoints. The process for selecting these terms involved collating an initial long list for potential inclusion, along with the ways in which each has been previously defined. These are provided as a supplementary annex to the main glossary. The method is further described in the following sub-section.
An initial list of potential terms to define was generated by cross-referencing existing glossaries. Terms that occurred in multiple glossaries were included in the long list. The definitions of these terms were extracted from these existing glossaries and are cited in the references. In addition, the relationship to the INCOSE Competencies is shown. The range of potential terms, and the variety of definitions that already exist, illustrate the complexity of describing complexity!
The authors used three categorisations of the definitions to help further group and classify the terms. The following categories are tagged to relevant terms in the glossary:
1. Property – whether or not the term describes a property applied to systems;
2. Principle – whether or not the term represents a principle that should be used when engineering complex situations or systems;
3. Approach – whether or not the term represents an approach, or element of an approach that should / could be used when engineering complex situations or systems.
Finally, explanatory commentary was added to most definitions to more specifically address an engineering education context.
Glossary:
Architecture
Definition: “an abstract description of the entities of a system and the relationship between those entities.” Crawley et al. (2016) System Architecture: Strategy & Product Development for Complex Systems
Boundary
#Property #Principle
Definition: “Define the system to be addressed. A description of the boundary of the system can include the following: definition of internal and external elements/items involved in realizing the system purpose as well as the system boundaries in terms of space, time, physical, and operational. Also, identification of what initiates the transitions of the system to operational status and what initiates its disposal is important.” NASA (2007) NASA Systems Engineering Handbook, p304
Commentary: The boundary defines the scope of the system being considered, and by implication, what sits outside of the system. As such, it is critically important to define the boundary of the system-of-interest. When dealing with complex systems this can be a challenging task and may even benefit from acknowledging multiple boundaries (e.g. physical, spatial, functional, logical etc.). For example, the boundary of the physical elements of a system could be considered within a wider boundary of the problem space.
Complexity
#Property
Definition: “A complex system is a system in which there are non-trivial relationships between cause and effect: each effect may be due to multiple causes; each cause may contribute to multiple effects; causes and effects may be related as feedback loops, both positive and negative; and cause-effect chains are cyclic and highly entangled rather than linear and separable.” INCOSE (2019) INCOSE Systems Engineering and Systems Definitions
Commentary: Early conceptions of complexity emphasised the difficulty in understanding, predicting or verifying the behaviours of a system. A key distinction arising from this is the complicated and complex are not synonymous. This concept of the difficulty in predicting behaviours is reflected in the definitions of the NASA Systems Engineering Handbook, SEBoK and ISO 24765. This is the key resultant consideration but does not describe the underlying property which causes this difficulty. While this definition relates more to complex systems than complexity, it is chosen for the way in which it goes beyond the consequences of complexity.
Coupling
#Property #Principle
Definition: “Coupling […] means to fasten together, or simply to connect things […] Coupling suggests a relationship between connected entities. If they are coupled, in some way they can affect each other […] For the system to be useful, its components have to be connected – coupled – so that they can work together. That said, putting them together arbitrarily won’t do the trick. The components have to be coupled in a way that achieves the goals of the system. Not only is coupling the glue that holds a system together, but it also makes the value of the system higher than the sum of its parts.” Khononov (2024) Balancing Coupling in Software Design: Universal Design Principles for Architecting Modular Software Systems, Ch1
Commentary: Coupling is a very important concept. It is the interconnection and interdependence that makes the system more (or less) than the sum of its parts. Standard Systems architecture advice is to minimise coupling between system elements (or between the systems in a system-of-systems). This is because high coupling correlates to higher structural complexity, reduced resilience and flexibility in the system, and introduces challenges for modularity in the system design. Lower or looser coupling means changes in one part of the system (in design or operation) are less likely to induce or require changes in another part. However, this lower coupling is not always possible and may be necessary to improve system performance (for example communication through intermediate layers in a system to reduce coupling can introduce unacceptable amounts of overhead and latency in the system). In design terms, high coupling between system elements means that those elements cannot be designed independently.
Emergence
#Principle
Definition: “As the entities of a system are brought together, their interaction will cause function, behaviour, performance and other intrinsic (anticipated and unanticipated) properties to emerge… Emergence refers to what appears, materializes, or surfaces when a system operates.” Crawley et al. (2016) System Architecture: Strategy & Product Development for Complex Systems
Commentary: It is worth noting that Crawley et al. (2014) go on to add “As a consequence of emergence, change propagates in unpredictable ways. System success occurs when anticipated emergence occurs, while system failure occurs when anticipated emergent properties fail to appear or when unanticipated undesirable emergent properties appear.” This emergence that gives rise to the difficulty in understanding, predicting or verifying the behaviours of a system (see Complexity).
Form
#Property
Definition: “The shape, size, dimensions, mass, weight, and other measurable parameters which uniquely characterize an item.” SAE International (2019) ANSI/EIA-649C
Function
#Principle #Approach
Definition: “A function is defined as the transformation of input flows, with defined performance targets for how well the function is performed in different conditions. A function usually has logical pre-conditions that trigger its operation. ”Systems Engineering Body of Knowledge v2.12 (2025)
Commentary: In general usage it is common to hear reference to ‘Form and Function’ in tandem, but it is the distinction between them and their relationship to one another that is important to engineering complex systems. Thinking in terms of functionality is a good way of abstracting the system to define what it does (or is needed to do) rather than what it is (and therefore by extension its form). Functions are normally allocated to single sub-elements of the system. Complexity arises at functional interfaces, or when different elements perform the same function. Thinking in terms of functionality encourages creativity as designers consider all the different ways in which the function could be performed – and then apply requirement constraints to choose the best/most feasible option. Thinking in terms of “objects” first constrains design by presupposing the solutions. Equally, when the solution goes wrong, thinking in terms of what function is failing and why, rather than focusing on a failed part allows identification of the true root cause. Organisations also have functions (such as Engineering, Human Resources, etc.) as a group of roles that perform a specific set of activities. This is important for considering the organisation/System that creates the engineered solution (which is itself a complex system, but secondary to the main application of the idea of function).
Iteration
#Approach
Definition: “Iteration is used as a generic term for successive application of a systems approach to the same problem situation, learning from each application, in order to progress towards greater stakeholder satisfaction.” Systems Engineering Body of Knowledge v2.12 (2025)
Lifecycle
#Property #Principle #Approach
Definition: “The evolution of a system, product, service, project or other human-made entity from conception through retirement.” ISO (2024) ISO/IEC/IEEE 24748-1:2024
Commentary: Understanding the lifecycle of an engineered artefact is very important. Issues arising in later stages (e.g. production, support/maintenance, upgrade and disposal) must be considered during the system’s initial development. In a system-of-systems or a capability system a significant source of complexity is the fact that different system elements have different lifecycles, and so may change or be changed independently of other elements with which they may interact or interdepend.
Model
#Approach
Definition: “An abstraction of a system, aimed at understanding, communicating, explaining, or designing aspects of interest of that system” Dori, D. (2003) Conceptual modelling and system architecting, p286
Commentary: An abstraction is a simplification. The selection of what to exclude, what to include, and at what level of granularity to depict it, is informed by the purpose of the model and the point of view from which it is created. Models do not have to be quantitative, nor is their purpose exclusively analytical.
Stakeholder
Definition: “A group or individual who is affected by or has an interest or stake in a program or project.” NASA (2019) NASA Systems Engineering Handbook SP-2016-6105 (Rev. 2)
Commentary: It is worth noting the potential difference between a stakeholder of the project that develops the system, and a stakeholder of the system that is developed.
System
#Principle #Approach
Definition: “A system is an arrangement of parts or elements that together exhibit behaviour or meaning that the individual constituents do not.” INCOSE (2019) INCOSE Fellows Briefing to INCOSE Board of Directors, January 2019
Commentary: There are many similar definitions of a system, each may offer a slightly different phrasing which can resonate better with different individuals. The origins of this definition is explained in the Systems Engineering Body of Knowledge. In assessing complexity in engineered system, the concept of “systems” is of course of key value. There are two important aspects two consider:
1) Many schools of Systems Science argue that systems do not actually exist (apart from perhaps the complete universe) – they are defined for the convenience of consideration, and so the definition of the boundary of the “system of interest” is both important and somewhat arbitrary. As such, the system-of-interest can have multiple useful boundaries. While it might be possible to identify and articulate the physical boundary of an engineered artefact (and it should be acknowledged), it might not be the most useful boundary to consider.
2) The point of defining a “system of interest” includes being able to consider it as a system and so use the properties seen in systems (boundary, interface with outside, affected by/affecting environment, made up of parts, part of something larger, has a lifecycle, seen differently by different people (with different perspectives), are dynamic, exhibit emergence etc.) as a “framework for curiosity” (as the INCOSE SE competency framework defines systems thinking).
In engineered systems (rather than natural systems) it is important to distinguish between purpose (what those engineering or creating it want it do) and emergence (what it actually does).
Systems Engineering
#Principle #Approach
Definition: “Systems Engineering is a transdisciplinary and integrative approach to enable the successful realization, use, and retirement of engineered systems, using systems principles and concepts, and scientific, technological, and management methods.” INCOSE (2019) INCOSE Systems Engineering and Systems Definitions
Systems Thinking
#Approach
Definition: “Systems thinking is thinking about a question, circumstance, or problem explicitly as a system – a set of interrelated entities.” Crawley et al. (2016) System Architecture: Strategy & Product Development for Complex Systems
Commentary: Crawley et al (2016) go on to add “This means identifying the system, its form and function, by identifying its entities and their interrelationships, its system boundary and context, and the emergent properties of the system based on the function of the entities, and their functional interactions.”
References:
Crawley, E. Cameron, B. & Selva, D. (2016). System Architecture: Strategy & Product Development for Complex Systems, Pearson
Dori, D. (2003). “Conceptual modeling and system architecting.” Communications of the ACM, 46(10), pp. 62-65.
ISO (2024). Systems and software engineering — Life cycle management -ISO/IEC/IEEE 24748-1:2024
Khononov, V. (2024). Balancing Coupling in Software Design: Universal Design Principles for Architecting Modular Software Systems, Addison-Wesley Professional,
NASA. (2007). Systems Engineering Handbook – Revision 1. Washington, DC, USA: National Aeronautics and Space Administration (NASA). NASA/SP-2007-6105.
NASA (2016). Systems Engineering Handbook – Revision 2. Washington, DC, USA, National Aeronautics and Space Administration (NASA). NASA/SP-2016-6105 (Rev. 2)
SAE International (2019). National Consensus Standard for Configuration Management -ANSI/EIA-649C
Any views, thoughts, and opinions expressed herein are solely that of the author(s) and do not necessarily reflect the views, opinions, policies, or position of the Engineering Professors’ Council or the Toolkit sponsors and supporters.
Downloads: A PDF of this resource will be available soon.
Who is this article for?: Thisarticle should be read by educators at all levels in higher education who are seekingto provide students with an overall perspective on complex systems in engineering.
Related INCOSE Competencies: Toolkit resources are designed to be applicable to any engineering discipline, but educators might find it useful to understand their alignment to competencies outlined by the International Council on Systems Engineering (INCOSE). The INCOSE Competency Framework provides a set of 37 competencies for Systems Engineering within a tailorable framework that provides guidance for practitioners and stakeholders to identify knowledge, skills, abilities and behaviours crucial to Systems Engineering effectiveness. A free spreadsheet version of the framework can be downloaded.
This resource relates to the Systems Thinking and Critical Thinking INCOSE competencies.
AHEP mapping: This resource addresses several of the themes from the UK’s Accreditation of Higher Education Programmes fourth edition (AHEP4): Analytical Tools and Techniques (critical to the ability to model and solve problems), and Integrated / Systems Approach (essential to the solution of broadly-defined problems).
Engineering systems today are increasingly complex, interconnected, and adaptive. To understand and manage them effectively, engineers must move beyond reductionist thinking where systems are broken into isolated parts and adopt systems thinking, which views systems as wholes made up of interacting components.
At the heart of this perspective lies emergence, a defining characteristic of complex systems. Emergence refers to properties or behaviours that arise from interactions among components but cannot be predicted or understood by examining those components in isolation. Appreciating emergence helps engineers anticipate how individual design decisions can produce system-level outcomes, sometimes beneficial, sometimes negative and unintended.
This article introduces the concept of emergence as one key characteristic of complex systems, situates it within systems thinking, and provides practical guidance for recognising and managing emergent behaviours in engineering practice.
1. What is a system?:
A system can be defined as “a set of interconnected elements organised to achieve a purpose” (Meadows, 2008). Systems possess structure (components), relationships (interactions), and purpose (function). Engineering systems such as aircraft, power grids, transport networks, or data infrastructures are composed of numerous subsystems that depend on each other.
Crucially, systems thinking emphasises interdependence and feedback. The behaviour of the whole cannot be fully explained by the behaviour of the parts alone. Properties such as resilience, adaptability, and emergence result from interactions within the system’s structure and environment. Recognising these relationships is essential to understanding how system-level behaviours arise.
Emergence describes the appearance of new patterns, properties, or behaviours at the system level that are not present in individual components. These properties are often irreducible: they cannot be explained solely by analysing each part separately (Holland, 2014).
Researchers distinguish between:
Weak emergence – behaviours that are theoretically predictable if all component interactions were known but are practically impossible to compute due to complexity (e.g. traffic flow patterns).
Strong emergence – properties that are fundamentally novel and irreducible to component-level descriptions (e.g., consciousness in biological systems).
In engineering, most emergent behaviours are weakly emergent: complex yet explainable with sufficient data and computational tools such as agent-based modelling or system dynamics.
A key caveat is that emergence depends on perspective and system boundaries. What seems emergent at one scale (e.g., the stability of a power grid) might appear straightforward when viewed at another. Therefore, engineers must define boundaries and assumptions clearly when analysing emergence.
3. Why emergence matters in engineering:
Emergence shapes how engineering systems behave, evolve, and sometimes fail. It can produce both desired outcomes (like adaptability or resilience) and undesired ones (like instability or cascading failure).
Understanding emergence enables engineers to:
anticipate how local interactions scale up to global system behaviour;
design feedback loops and architectures that promote stability; and
identify potential points for intervention when emergent behaviour becomes undesirable.
For instance, in cyber-physical systems, emergent coordination can enhance efficiency, but it may also create unpredictable vulnerabilities if feedback loops reinforce errors. Engineers therefore must not only observe emergence but learn how to influence it through design and governance.
4. Recognising and managing emergent behaviour:
Recognising emergence
Engineers can identify emergence by looking for:
System-level patterns that do not trace directly to any single component (e.g. global traffic flow or collective oscillations in a power grid).
Unexpected behaviours, such as new failure modes or self-organising phenomena.
Scale-dependent properties, where behaviour changes qualitatively as the system grows or interacts with its environment.
Adaptive or learning responses, where the system adjusts without explicit central control.
Intervening in emergent systems
Not all emergence is beneficial. Engineers often need to mitigate unwanted emergent behaviours such as instability or inefficiency while reinforcing desirable ones. Effective approaches include:
Redesigning interactions rather than individual components, focusing on how feedback and connectivity shape outcomes.
Introducing constraints or buffers to dampen runaway feedback loops.
Enhancing diversity and modularity so subsystems can adapt locally without propagating failures globally.
Monitoring system states continuously, using sensors, data analytics, or digital twins to detect emergent behaviour early.
Managing emergence requires humility: complex systems cannot be fully controlled, only influenced. The goal is to guide system dynamics toward safe and productive outcomes.
5. Illustrative examples of emergence in engineering systems:
Network systems
The Internet exemplifies emergence: billions of devices follow simple communication protocols, yet collectively create a resilient, adaptive global network. No single node dictates its performance; instead, routing efficiency and viral content propagation arise from local interactions among routers and users.
Transportation systems
Urban traffic patterns such as congestion waves, spontaneous lane formation, and adaptive rerouting emerge from individual driver behaviour and infrastructural design. Traffic engineers use simulation models to study how simple decision rules generate complex city-wide flows.
Energy systems
Electrical grids maintain frequency and voltage stability through distributed interactions among generators, loads, and controllers. Emergent synchronisation enables reliability, but loss of coordination can cause cascading blackouts showing both beneficial and harmful emergence.
Manufacturing systems
In smart factories, machines and sensors collaborate autonomously, producing system-wide optimisation in scheduling and quality control. Adaptive algorithms and feedback loops create emergent flexibility beyond what central planning alone could achieve.
6. Practical guidance for engineers and educators:
For engineers, the key is to design with emergence in mind:
focus on local rules that encourage desirable global behaviour;
incorporate feedback and sensing to detect changes early; and
use modular, diverse architectures to enhance resilience.
For educators, teaching emergence provides an opportunity to bridge theory and practice. Software such as NetLogo and Insight Maker allows students to visualise emergent behaviour through agent-based and system-dynamics models. Linking engineering examples to ecological, social, or digital systems helps learners appreciate the universality of emergence.
Conclusion:
Emergence is not an anomaly to be avoided but a natural attribute of complex systems. It challenges traditional engineering by revealing that system behaviour often arises from relationships, not components.
Understanding emergence equips engineers to recognise interdependencies, design adaptive solutions, and work with complexity rather than against it. By embracing systems thinking, engineers can create technologies that are not only functional but resilient, sustainable, and aligned with real-world dynamics.
References:
Holland, J.H. (2014). Complexity: A Very Short Introduction. Oxford: Oxford University Press.
Johnson, S. (2001). Emergence: The Connected Lives of Ants, Brains, Cities, and Software. New York: Scribner.
Mitchell, M. (2009). Complexity: A Guided Tour. Oxford: Oxford University Press.
Bar-Yam, Y. (2003). Dynamics of Complex Systems. Cambridge, MA: Perseus Publishing.
Helbing, D. (2013). Globally networked risks and how to respond. Nature, 497(7447), 51-59.
Any views, thoughts, and opinions expressed herein are solely that of the author(s) and do not necessarily reflect the views, opinions, policies, or position of the Engineering Professors’ Council or the Toolkit sponsors and supporters.
Licensing:This work is licensed under a Creative Commons Attribution-ShareAlike 4.0 International License. It is based upon the author’s 2025 article “A Simulation Tool for Pinch Analysis and Heat Exchanger/Heat Pump Integration in Industrial Processes: Development and Application in Challenge-based Learning”. Education for Chemical Engineers 52, 141–150.
Related INCOSE Competencies: Toolkit resources are designed to be applicable to any engineering discipline, but educators might find it useful to understand their alignment to competencies outlined by the International Council on Systems Engineering (INCOSE). The INCOSE Competency Framework provides a set of 37 competencies for Systems Engineering within a tailorable framework that provides guidance for practitioners and stakeholders to identify knowledge, skills, abilities and behaviours crucial to Systems Engineering effectiveness. A free spreadsheet version of the framework can be downloaded.
This resource relates to the Systems Thinking, Systems Modelling and Analysis and Critical Thinking INCOSE competencies.
AHEP mapping: This resource addresses several of the themes from the UK’s Accreditation of Higher Education Programmes fourth edition (AHEP4): Analytical Tools and Techniques (critical to the ability to model and solve problems), and Integrated / Systems Approach (essential to the solution of broadly-defined problems). In addition, this resource addresses the themes of Science, mathematics and engineering principles; Problem analysis; and Design.
Educational level: Intermediate.
Educational aim:To equip learners with the ability to model, analyse, and optimise pathways for industrial decarbonisation through a complex-systems lens – integrating technical, economic, and policy dimensions – while linking factory-level design decisions to wider value-chain dynamics, multi-stakeholder trade-offs, and long-term sustainability impacts.
Learning and teaching notes:
This teaching activity explores heat integration for the decarbonisation of industrial processes through the lens of complex systems thinking, combining simulation, systems-level modelling, and reflective scenario analysis. It is especially useful in modules related to energy systems, process systems, or sustainability.
Learners analyse a manufacturing site’s energy system using a custom-built simulation tool to explore the energy, cost and carbon-emission trade-offs of different heat-integration strategies. They also reflect on system feedback, stakeholder interests and real-world resilience using causal loop diagrams and role-played decision frameworks.
This activity frames industrial heat integration as a complex adaptive system, with interdependent subsystems such as process material streams, utilities, technology investments and deployments, capital costs, emissions, and operating constraints.
Learners run the simulation tool to generate outputs to explore different systems integration strategies: pinch-based heat recovery by heat exchangers, with and without heat pump-based waste heat upgrade. Screenshots of the tool graphical user interface are attached as separate files:
The learning is delivered in part, through active engagement with the simulation tool. Learners interpret the composite and grand composite curves and process tables, to explore how system-level outcomes change across various scenarios. Learners explore, using their generated simulation outputs, how subsystems (e.g. hot and cold process streams, utilities) interact nonlinearly and with feedback effects (e.g., heat recovery impacts), shaping global system behaviour and revealing leverage points and emergent effects in economics, emissions and feasibility.
Using these outputs as a baseline, and exploring other systems modelling options, learners evaluate trade-offs between heat recovery, capital expenditure (CAPEX), operating costs (OPEX), and carbon emissions, helping them develop systems-level thinking under constraints.
The activity embeds scenario analysis, including causal loop diagrams, what-if disruption modelling, and stakeholder role-play, using multi-criteria decision analysis (MCDA) to develop strategic analysis and systems mapping skills. Interdisciplinary reasoning is encouraged across thermodynamics, economics, optimisation, engineering ethics, and climate policy, culminating in reflective thinking on system boundary definitions, trade-offs, sustainability transitions and resilience in industrial systems.
Learners have the opportunity to:
Analyse non-linear interactions in thermodynamic systems.
Reconcile conflicting demands (e.g. energy savings vs costs vs emissions vs technical feasibility) using data generated from real system simulation.
Model and interpret feedback-driven process systems using pinch analysis, heat recovery via heat exchangers, and heat upgrade via heat pump integration.
Explore emergent behaviour, trade-offs, and interdisciplinary constraints.
Navigate system uncertainties by simulation data analysis and scenario thinking.
Understand the principles of heat integration using pinch analysis, heat exchanger networks, and heat pump systems, framed within complex industrial systems with interdependent subsystems.
Evaluate decarbonisation strategies and their performances in terms of energy savings, CAPEX/OPEX, carbon reduction, and operational risks, highlighting system-level trade-offs and nonlinear effects
Develop data-driven decision-making, navigating assumptions, parameter sensitivity, and model limitations, reflecting uncertainty and systems adaptation.
Explore ethical, sustainability, and resilience dimensions of engineering design, recognising how small changes or policy shifts may act on leverage points and produce emergent behaviours.
Analyse stakeholder dynamics, policy impacts, and uncertainty as part of the broader system environment influencing energy transition pathways.
Construct and interpret causal loop diagrams (CLDs), explore what-if scenarios, and apply multi-criteria decision analysis (MCDA), building competencies in feedback loops, system boundaries, and systems mapping.
Teachers have the opportunity to:
Embed systems thinking and complex systems pedagogy into energy and process engineering, using real-world simulations and data-rich problem-solving.
Introduce modelling and scenario-based reasoning, helping students understand how interactions between process units, energy streams, and external factors affect industrial decarbonisation.
Facilitate exploration of design trade-offs, encouraging learners to consider technical feasibility, economic sustainability, and environmental constraints within dynamic system contexts.
Support students in identifying leverage points, feedback loops, and emergent behaviours, using tools like CLDs, composite curves, and stakeholder role play.
Assess complex problem-solving capacity, including students’ ability to model, critique and adapt industrial systems under conflicting constraints and uncertain futures.
Proprietary Simulator for Pinch Analysis & Heat Integration. Freely available for educational use and can be accessed online through a secure link provided by the author on request (james.atuonwu@nmite.ac.uk or james.atuonwu@gmail.com). No installation or special setup is required; users can access it directly in a web browser.
About the simulation tool (access and alternatives):
This activity uses a Streamlit-based simulation tool, supported with process data (Appendix A, Table 1, or an educator’s equivalent). The tool is freely available for educational use and can be accessed online through a secure link provided by the author on request (james.atuonwu@nmite.ac.uk or james.atuonwu@gmail.com). No installation or special setup is required; users can access it directly in a web browser.The activity can also be replicated using open-source or online pinch analysis tools such as OpenPinch, PyPinchPinCH, TLK-Energy Pinch Analysis Online. SankeyMATIC can be used for visualising energy balances and Sankey diagrams.
Pinch Analysis, a systematic method for identifying heat recovery opportunities by analysing process energy flows, forms the backbone of the simulation. A brief explainer and further reading are provided in the resources section. Learners are assumed to have prior or guided exposure to its core principles. A key tunable parameter in Pinch Analysis, ΔTmin, represents the minimum temperature difference allowed between hot and cold process streams. It determines the required heat exchanger area, associated capital cost, controllability, and overall system performance. The teaching activity helps students explore these relationships dynamically through guided variation of ΔTmin in simulation, reflection, and trade-off analysis, as outlined below.
Introducing and prioritising ΔTmin trade-offs:
ΔTmin is introduced early in the activity as a critical decision variable that balances heat recovery potential against capital cost, controllability, and safety. Students are guided to vary ΔTmin within the simulation tool to observe how small parameter shifts affect utility demands, exchanger area, and overall system efficiency. This provides immediate visual feedback through the composite and grand composite curves, helping them connect technical choices to system performance.
Educators facilitate short debriefs using the discussion prompts in Part 1 and simulation-based sensitivity analysis in Part 2. Students compare low and high ΔTmin scenarios, reasoning about implications for process economics, operability, and energy resilience.
This experiential sequence allows learners to prioritise competing factors (technical, economic, and operational), while recognising that small changes can create non-linear, system-wide effects. It reinforces complex systems principles such as feedback loops and leverage points that govern industrial energy behaviour.
Data for decisions:
The simulator’s sidebar includes some default values for energy prices (e.g. gas and electricity tariffs) and emission factors (e.g. grid carbon intensity), which users can edit to reflect their own local or regional conditions. For those replicating the activity with other software tools, equivalent calculations of total energy costs, carbon emissions and all savings due to heat recovery investments can be performed manually using locally relevant tariffs and emission factors.
The Part 1–3 tasks, prompts, and assessment suggestions below remain fully valid regardless of the chosen platform, ensuring flexibility and accessibility across different teaching contexts.
Educator support and implementation notes:
The activity is designed to be delivered across 3 sessions (6–7.5 hours total), with flexibility to adapt based on depth of exploration, simulation familiarity, or group size. Each part can be run as a standalone module or integrated sequentially in a capstone-style format.
Part 1: System mapping: (Time: 2 to 2.5 hours) – Ideal for a classroom session with blended instruction and group collaboration:
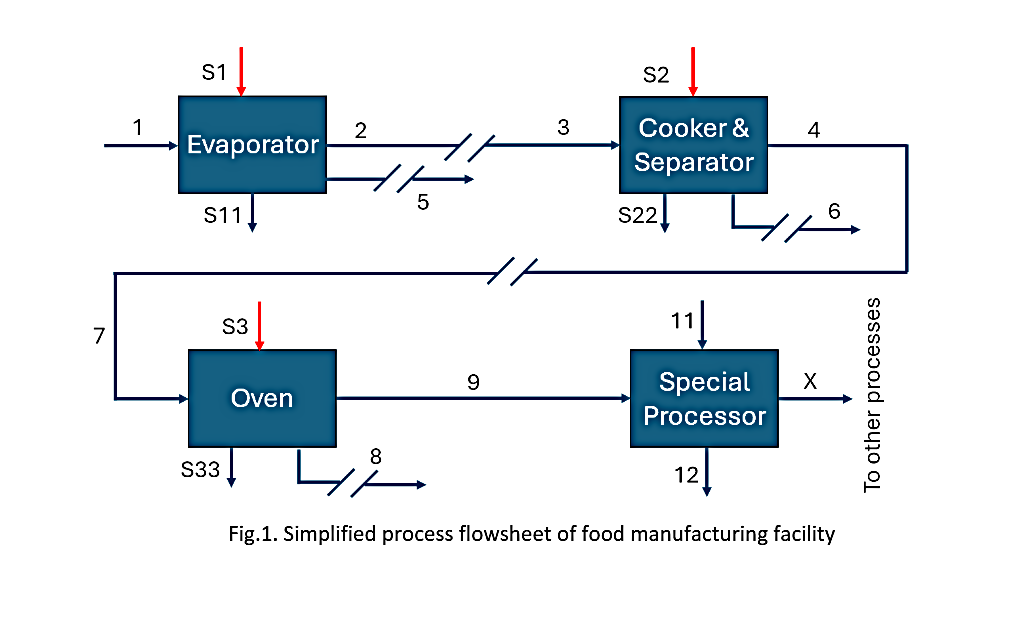
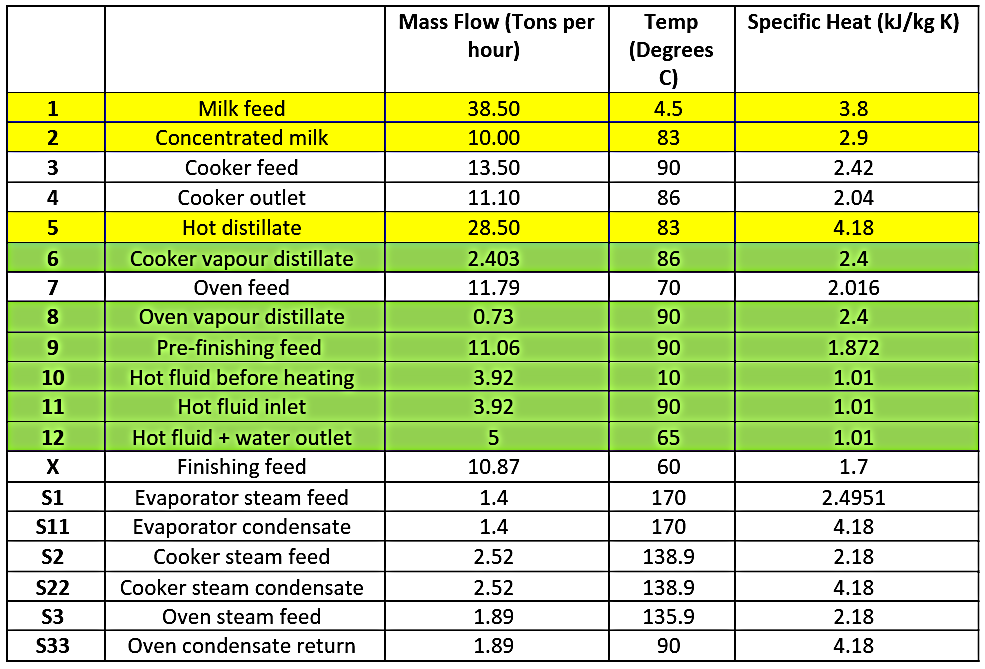
This stage introduces students to the foundational step of any heat integration analysis: system mapping. The aim is to identify and represent energy-carrying streams in a process plant, laying the groundwork for further system analysis. Educators may use the Process Flow Diagram of Fig. 1, Appendix A (from a real industrial setting: a food processing plant) or another Process Diagram, real or fictional. Students shall extract and identify thermal energy streams (hot/cold) within the system boundary and map energy balances before engaging with software to produce required simulation outputs.
Key activities and concepts include:
Defining system boundaries: Focus solely on thermal energy streams, ignoring non-thermal operations. The boundary is drawn from heat sources (hot streams) to heat sinks (cold streams).
Identifying hot and cold streams: Students classify process material streams based on whether they release or require heat. Each stream is defined by its inlet and target temperatures and its heat capacity flow rate (CP).
Building the stream table: Students compile a simple table of hot/cold streams (name, supply temperature, target temperature and heat capacity flow CP).
Constructing energy balances and Sankey Diagrams: Students manually calculate energy balances across each subsystem in the defined system boundary, identifying energy inputs, useful heat recovery, and losses. Using this information, they construct Sankey diagrams to visualise the magnitude and direction of energy flows, strengthening their grasp of system-wide energy performance before optimisation.
Pinch Concept introduction: Students are introduced to the concept of “the Pinch”, including the minimum heat exchanger temperature difference (ΔTmin) and how it affects heat recovery targets (QREC), as well as overall heating and cooling utility demands (QHU & QCU, respectively).
Assumptions: All analysis is conducted under steady-state conditions with constant CP and no heat losses.
Discussion prompts:
What insights does the Sankey diagram reveal about energy use, waste and recovery potential in the system? How might these visual insights shape optimisation decisions?
Why might certain streams be excluded from the analysis?
How does the choice of ΔTmin influence the heat recovery potential and cost?
What trade-offs are involved in system simplification during mapping?
How can assumptions (like steady-state vs. transient) impact integration outcomes?
Student deliverables:
A labelled system map showing the thermal process boundaries, hot and cold streams.
A structured stream data table.
Justification for selected ΔTmin values based on process safety, economics, or practical design and operational considerations.
A basic Sankey diagram representing the energy flows in the mapped system, based on calculated heat duties of each stream.
Part 2: Running and interpreting process system simulation results (Time: 2 to 2.5 hours) – Suitable for lab or flipped delivery;only standard computer access is needed to run the tool (optional instructor demo can extend depth):
Students use the simulation tool to generate their own results.The process scenario of Fig. 1, Appendix A, with the associated stream data (Table 1) can be used as a baseline.
Tool-generated outputs:
Curves: Composite and Grand Composite (pinch location, recovery potential).
Scenario summary: QREC, QHU, QCU; COP (where applicable); CAPEX/OPEX/CO₂; payback period for various values of system levers (e.g., ΔTmin levels, tariffs, emission factors).
Heat Pump (HP) tables: Feasible pairs, Top-N heat pump selections (where N = 0, 1, or 2); QEVAP, QCOND, QCOMP, COP. All notations are designated in the simulator’s help/README section.
Learning tasks:
1. Scenario sweeps Run different scenarios (e.g., different ΔTmin levels, tariffs, emission factors, and Top-N HP selections). Prompts: How do QREC, QHU/QCU, HX area, and CAPEX/OPEX/CO₂ shift across scenarios? Which lever moves the needle most?
2. Group contrast (cases A vs B: see time-phased operations A & B in Appendix A) Assign groups different cases; each reports system behaviours and trade-offs. Prompts: Where do you see CAPEX vs. energy-recovery tension? Which case is more HP-friendly and why?
3. Curve reading Use the Composite & Grand Composite Curves to identify pinch points and bottlenecks; link features on the curves to the tabulated results. Prompts: Where is the pinch? How does ΔTmin change the heat-recovery target and utility demands?
4. Downstream implications Trace how curve-level insights show up in HX sizing/costs and HP options. Prompts: When does adding HP reduce utilities vs. just shifting costs? Where do stream temperatures/CP constrain integration?
5. Systems lens: feedback and leverage Map short causal chains from the results (e.g., tariffs → HP use → electricity cost → OPEX; grid-carbon → HP emissions → net CO₂). Prompts: Which levers (ΔTmin, tariffs, EFs, Top-N) create reinforcing or balancing effects?
Outcome:
Students will be able to generate and interpret industrial simulation outputs, linking technical findings to economic and emissions consequences through a systems-thinking lens. They begin by tracing simple cause–effect chains from the simulation data and progressively translate these into causal loop diagrams (CLDs) that visualise reinforcing and balancing feedback. Through this, learners develop the ability to explain how system structure drives performance both within the plant and across its broader industrial and policy environment.
Optional extension: Educators may provide 2–3 predefined subsystem options (e.g., low-CAPEX HX network, high-COP HP integration, hybrid retrofit) for comparison. Students can use a decision matrix to justify their chosen configuration against CAPEX, OPEX, emissions, and controllability trade-offs.
Part 3: Systems thinking through scenario analysis (Time: 2 to 2.5 hours) – Benefits from larger-group facilitation, a whiteboard or Miro board (optional), and open discussion. It is rich in systems pedagogy:
Having completed simulation-based pinch analysis and heat recovery planning, learners now shift focus to strategic implementation challenges faced in real-world industrial settings. In this part, students apply systems thinking to explore the broader implications of their heat integration simulation output scenarios, moving beyond process optimisation to consider real-world dynamics, trade-offs, and stakeholder interactions. The goal is to encourage students to interrogate the interconnectedness of decisions, feedback loops, and unintended consequences in process energy systems including but not limited to operational complexity, resilience to disruptions, and alignment with long-term sustainability goals.
Activity: Stakeholder role play / Multi-Criteria Decision Analysis Students take on stakeholder roles and debate which design variant or operating strategy should be prioritised. They then conduct a Multi-Criteria Decision Analysis (MCDA), evaluating each option based on criteria such as CAPEX, OPEX savings, emissions reductions, risk, and operational ease.
Stakeholders include:
Operations managers, focused on ease of control and process stability.
Investors and finance teams, focused on return on investment.
Environmental officers, concerned with emissions and policy compliance.
Engineers, responsible for design and retrofitting.
Community members, advocating for sustainable industry practices.
Government reps responsible for regulations and policy formulation, e.g. taxes and subsides.
The team must present a strategic analysis showing how the heat recovery system behaves as a complex adaptive system, and how its implementation can be optimised to balance technical, financial, environmental, and human considerations.
Optional STOP for questions and activities:
Before constructing causal loop diagrams (CLDs), learners revisit key results from their simulation — such as ΔTmin, tariffs, emission factors, and system costs — and trace how these parameters interact to influence overall system performance. Educators guide this transition, helping students abstract quantitative outputs (e.g., changes in QREC, OPEX, or CO₂) into qualitative feedback relationships that reveal cause-and-effect chains. This scaffolding helps bridge the gap between process simulation and systems-thinking representation, supporting discovery of reinforcing and balancing feedback structures.
Activity: Construct a causal loop diagram (CLD) Students identify at least five variables that interact dynamically in the implementation of a heat integration system (e.g. energy cost, investment risk, emissions savings, system complexity, staff training). They must map reinforcing and balancing feedback loops that illustrate trade-offs or virtuous cycles.
Where could policy or process changes trigger leverage points?
How could delays in response (e.g. slow staff adaptation to new technologies) affect outcomes?
How might design choices affect local energy equity, air quality, or community outcomes?
What policy incentives or ethical trade-offs might reinforce or hinder your proposed solution?
Instructor debrief (engineering context with simulation linkage): After students share their CLDs, the educator facilitates a short discussion linking their identified reinforcing and balancing loops to common dynamic patterns observable in the simulation results. For instance:
Limits to growth: As ΔTmin decreases, heat recovery (QREC) initially improves, but exchanger area, CAPEX, and controllability demands grow disproportionately — diminishing overall economic benefit.
Shifting the burden: Installing a heat pump may appear to improve carbon performance, but if low process efficiency remains unaddressed, electricity use and OPEX rise — creating a new dependency that shifts rather than solves the problem.
Tragedy of the commons: Competing units or stakeholders optimising locally (e.g. for their own OPEX or production uptime) can undermine total system efficiency or resilience.
Success to the successful: Design options with early financial or policy support (e.g. high-COP heat pumps) attract more investment and attention, reinforcing a positive but unequal feedback loop.
This reflection connects quantitative model outputs (e.g. QREC, OPEX, CAPEX, emissions) to qualitative system behaviours, helping learners recognise leverage points and understand how design choices interact across technical, economic, and social dimensions of decarbonisation.
Activity: Explore “What if?” scenarios
Working in groups, students choose one scenario to explore using a systems lens:
What if gas prices fluctuate drastically?
What if capital funding is delayed by 6 months?
What if a heat exchanger fouls during peak season?
What if CO₂ emissions policy tightens?
What if current electricity grid decarbonisation trends suffer an unexpected setback?
What if government policies now encourage onsite renewable electricity generation?
Each group evaluates the resilience and flexibility of the proposed integration design. They consider:
System bottlenecks and fragilities.
Leverage points for intervention.
Need for redundancy or modular design.
Educators may add advanced scenarios (e.g. carbon tax introduction, supplier failure, or project delay) to challenge students’ resilience modelling and stakeholder negotiation skills.
Stakeholder impact reflection:
To extend systems reasoning beyond the technical domain, students assess how their chosen design scenarios (e.g., low vs. high ΔTmin, with or without heat pump integration) affect each stakeholder group. For instance:
Operations managers assess control complexity, downtime risk, and maintenance implications.
Finance teams evaluate CAPEX/OPEX trade-offs and payback periods.
Environmental officers examine lifecycle emissions and regulatory compliance.
Engineers reflect on reliability, retrofit feasibility, and process safety.
Community members or regulators consider social and policy outcomes, such as visible sustainability impact or energy equity.
Each team member rates perceived benefits, risks, or compromises under each design case, and the results are summarised in a stakeholder impact matrix or discussion table. This exercise links quantitative system metrics (energy recovery, emissions, cost) to qualitative stakeholder outcomes, reinforcing the “multi-layered feedback” perspective central to complex systems analysis.
Learning Outcomes (Part 3):
By the end of this part, students will be able to:
Identify systemic interdependencies in industrial energy systems.
Analyse how feedback loops and delays influence system behaviour.
Assess the resilience of energy integration solutions under different future scenarios.
Balance multiple stakeholder objectives in complex engineering contexts.
Apply systems thinking tools to communicate complex technical scenarios to diverse stakeholder audiences.
Use systems diagrams and decision tools to support strategic analysis.
Instructor Note – Guiding CLD and archetype exploration:
Moving from numerical heat-exchange and cost data to CLD archetypes can be conceptually challenging. Instructors are encouraged to model this process by identifying at least one reinforcing loop (e.g. “energy savings → lower OPEX → more investment in recovery → further savings”) and one balancing loop (e.g. “higher capital cost → reduced investment → lower heat recovery”). Relating these loops to common system archetypes such as “Limits to Growth” or “Balancing with Delay” helps students connect engineering data to broader system dynamics and locate potential leverage points. The activity concludes with students synthesising their findings from simulation, systems mapping, and stakeholder analysis into a coherent reflection on complex system behaviour and sustainable design trade-offs.
Assessment guidance:
This assessment builds directly on the simulation and systems-thinking activities completed by students. Learners generate and interpret their own simulation outputs (or equivalent open-source pinch analysis results), using these to justify engineering and strategic decisions under uncertainty.
Assessment focuses on students’ ability to integrate quantitative analysis (energy, cost, carbon) with qualitative reasoning (feedbacks, trade-offs, stakeholder dynamics), demonstrating holistic systems understanding.
Deliverables (portfolio; individual or group):
1. Reading and interpretation of simulation outputs
Use the outputs you generate (composite & grand composite curves: HX match/area/cost tables; HP pairing/ranking; summary sheets of QHU, QCU, QREC, COP, CAPEX, OPEX, CO₂, paybacks) for a different industrial process (from the one used in the main learning activity) to:
Identify the pinch point(s) and explain what the curves imply for recovery potential and bottlenecks.
Comment on QHU/QCU/QREC and how they change across the scenarios you run (e.g., ΔTmin, tariffs, emission factors, Top-N HP selection).
Interpret trade-offs among energy, CAPEX, OPEX, emissions, using numbers reported by the simulator. No calculations beyond light arithmetic/annotation.
2. Systems mapping and scenario reasoning
A concise system boundary sketch and a simple stream table.
A Causal Loop Diagram (CLD) highlighting key feedbacks (e.g., tariffs ↔ HP use ↔ grid carbon intensity ↔ emissions/cost).
A short MCDA (transparent criteria/weights) comparing the scenario variants you test; include a brief stakeholder reflection.
3. Decision memo (max 2 pages)
Your recommended integration option under stated assumptions, with one “what-if” sensitivity (e.g., +20% electricity price, tighter CO₂ factor).
State uncertainties/assumptions and any implementation risks (operations, fouling, timing of capital).
Students should include a short reflective note addressing assumptions, feedback insights, and how their stakeholder perspective shaped their recommendation.
Appendix A: Example process scenario for teaching activity:
Sample narrative: Large-scale food processing plant with time-sliced operations
The following process scenario explains the industrial context behind the main teaching activity simulations. A large-scale food processing plant operates a milk product manufacturing line. The process, part of which is shown in Fig. 1, involves the following:
Thermal evaporation of milk feed.
Cooking operations after other ingredient mixing and formulation upstream.
Oven heating to drive off moisture and stimulate critical product attributes.
Pre-finishing operations as the product approaches packaging.
In real operations, the evaporation subprocessoccurs at different times from the cooking/separation, oven and pre-finishing operations. This means that their hot and cold process streams are not simultaneously available for direct heat exchange. For a realistic industrial pinch analysis, the process is thus split into two time slices:
Time Slice A (used for scenario Case A): Evaporation streams only.
Time Slice B (Case B): Cooking/separation, oven and pre-finishing streams only.
Separate pinch analyses are performed for each slice, using the yellow-highlighted sections of Table 1 as stream data for time slice A, and the green-highlighted sections as stream data for time slice B. Any heat recovery between slices would require thermal storage (e.g., a hot-water tank) to bridge the time gap.
Fig.1. Simplified process flowsheet of food manufacturing facility.
Note on storage and system boundaries:
Because the two sub-processes occur at different times, direct process-to-process heat exchange between their streams is not possible without thermal storage. If storage is introduced:
Production surplus heat at time slice A can be stored at high temperature (e.g., 80 °C) and later discharged to preheat time slice B cold streams.
The size of the tank depends on the portion of hot utility demand of sub-process B to be offset, the temperature swing, and the duration of the sub-process B.
Table 1. Process stream data corresponding to flowsheet of Fig. 1. Yellow-highlighted sections represent processes available at time slice A, while green-highlighted sections are processes available at time slice B.
Appendix B: Suggested marking rubric (Editable):
Adopter note: The rubric below is a suggested template. Instructors may adjust criteria language, weightings and band thresholds to align with local policies and learning outcomes. No marks depend on running software.
1) Interpretation of Simulation Outputs — 25%
A (Excellent): Reads curves/tables correctly; uses QHU/QCU/QREC, COP, CAPEX/OPEX/CO₂, payback figures accurately; draws clear, defensible trade-offs.
B (Good): Mostly accurate; links numbers to decisions with some insight.
C (Adequate): Mixed accuracy; limited or generic trade-off discussion.
D/F (Weak): Frequent misreads; cherry-picks or contradicts generated data.
2) Systems Thinking & Scenario Analysis — 30%
A: Clear CLD with at least one reinforcing and one balancing loop; leverage points identified; scenarios coherent; MCDA with explicit criteria, weights, and justified ranking; uncertainty acknowledged.
B: Reasonable CLD; scenarios sound; MCDA present with partial justification.
C: Superficial CLD; scenarios/MCDA incomplete or weakly reasoned.
D/F: Little or no systems view; scenarios/MCDA absent or not meaningful.
Atuonwu, J.C. (2025). A Simulation Tool for Pinch Analysis and Heat Exchanger/Heat Pump Integration in Industrial Processes: Development and Application in Challenge-based Learning. Education for Chemical Engineers 52, 141-150.
Oh, X.B., Rozali, N.E.M., Liew, P.Y., Klemes, J.J. (2021). Design of integrated energy- water systems using Pinch Analysis: a nexus study of energy-water-carbon emissions. Journal of Cleaner Production 322, 129092.
Rosenow, J., Arpagaus, C., Lechtenböhmer, S.,Oxenaar, S., Pusceddu, E. (2025). The heat is on: Policy solutions for industrial electrification. Energy Research & Social Science 127, 104227.
Bale, C.S.E., Varga, L., Foxon, T.J. (2015). Energy and complexity: New ways forward. Applied Energy 138, 150-159.
Atuonwu, J.C. (2025). Proprietary Simulator for Pinch Analysis & Heat Integration. Private reviewer access available on request (demo video or temporary login).
Any views, thoughts, and opinions expressed herein are solely that of the author(s) and do not necessarily reflect the views, opinions, policies, or position of the Engineering Professors’ Council or the Toolkit sponsors and supporters.
Keywords: Artificial Intelligence; Large Language Model; Sociotechnical systems; Ethics; Modelling or simulation; Emergence.
Licensing:This work is licensed under a Creative Commons Attribution-ShareAlike 4.0 International License. It is based upon the author’s article “Enhancing Ethical Reasoning in Engineering Education through Student-Created Interactive Ethical Scenarios Using Generative AI,” 2025 IEEE Global Engineering Education Conference (EDUCON), London, United Kingdom, 2025, pp. 1-5, doi: 10.1109/EDUCON62633.2025.11016531.
Related INCOSE Competencies: Toolkit resources are designed to be applicable to any engineering discipline, but educators might find it useful to understand their alignment to competencies outlined by the International Council on Systems Engineering (INCOSE). The INCOSE Competency Framework provides a set of 37 competencies for Systems Engineering within a tailorable framework that provides guidance for practitioners and stakeholders to identify knowledge, skills, abilities and behaviours crucial to Systems Engineering effectiveness. A free spreadsheet version of the framework can be downloaded.
This resource relates to the Systems Thinking, Life Cycle, Configuration Management, Requirements Definition, Verification, and Validation INCOSE Competencies.
AHEP mapping: This resource addresses several of the themes from the UK’s Accreditation of Higher Education Programmes fourth edition (AHEP4): Analytical Tools and Techniques (critical to the ability to model and solve problems), and Integrated / Systems Approach (essential to the solution of broadly-defined problems). In addition, this resource addresses AHEP themes of Ethics and Communication.
Debug their simulation through playtesting, documenting issue → fix → retest cycles and demonstrating how changes improve coherence.
Explore trade-offs and justify decisions in ethics (e.g. consequences and equity) and complex systems (e.g. resilience vs cost vs emissions).
Evidence learning with transparent artefacts: initial prompt, changes via tracked changes or before/after snippets, tester feedback, and final prompt.
Reflect critically on validity, bias and the limitations of LLMs as simulators, including how to handle unsafe/poor choices by surfacing realistic consequences.
Communicate findings clearly to technical and nontechnical audiences.
Teachers have the opportunity to:
Use this as either a studio activity (3–5 sessions) or a compact assessment only task (1–2 sessions), with clear rubrics for each.
Standardise scope by offering a predefined scenario (e.g., Urban Heatwave Response, UK city), or permit student proposed topics.
Scale marking via artefact based evidence (prompt, change log, feedback, final prompt) rather than long reports.
Deliver with institutional Microsoft Copilot licences or any free web LLM; require students to disclose model and version used.
Adapt quickly to different disciplines by swapping the scenario pack (microgrids, water networks, medical device supply chains, etc.).
Overview:
This resource enables engineering students to create, run, and debug a text‑based, interactive simulation of a complex sociotechnical system using a Large Language Model (LLM). It is intentionally flexible and may be delivered as a multi‑session studio activity (including assessment) or used solely as a compact assessment.
Purpose and use:
In both modes, students design a robust text prompt, test it with a user, document changes, and submit auditable artefacts that evidence learning. The key activity is interrogating their own thinking on how complex systems should be modelled by making judgements as to how their game does and does not capture the system dynamics.
The submission is a text LLM prompt with tracked changes, which allows students to demonstrate system design and debugging, produce transparent process evidence, and scale to large cohorts with minimal infrastructure.
Delivery options at a glance:
Audience
Undergraduate Years 2–4 and taught MSc, any engineering discipline
Modes
Studio activity (3–5×2 h + independent study) or Assessment‑only (prompt‑only; 1–2×2 h + 4–6 h)
Teams
3–4 students (solo permitted for assessment‑only)
Assessment
Portfolio (studio) or prompt‑plus‑change‑log (assessment‑only)
Platforms
Institutional Copilot licences successful; encourage exploration of free tools (students record model/version)
Materials and software:
LLM access: institutional Microsoft Copilot licences (proven) or any reputable free web‑based tool. Students disclose the model and version.
Delivery modes:
Mode A — Studio activity (3–5 sessions)
Session 1: Frame the system — boundary, stakeholders, conflicting goals; sketch a Causal Loop Diagram (CLD) with at least two reinforcing and two balancing loops.
Session 2: Make it playable — define 4–8 state variables and KPIs; draft the prompt (based on Appendix A); specify commands, turn length and stop conditions; add debug controls (`trace`, `why`, `show variables`, `revert`).
Between sessions: Prototype v1 — run 10–15 turns; capture a transcript; log defects (e.g. inconsistent updates, missing delays, moralising responses).
Session 3: Play‑test and iterate — exchange prototypes across teams or test with an external user; record issue → fix → re‑test cycles with evidence (make sure edits are captured in tracked changes).
Session 4: Present and reflect — short demo (6–8 turns); explain how feedback/delays manifest; discuss surprises and limits.
Mode B — Assessment‑only (prompt‑only; 1–2 sessions)
Session 1: Brief and rapid scoping — select a scenario (student‑chosen or predefined); write a one‑paragraph boundary and stakeholders note; draft the initial prompt (based on Appendix A) with role choices, 4–6 state variables, simple commands, and a 12–15 turn cap.
Independent work: Debugging loop — run the prompt; identify faults; edit the prompt (make sure edits are captured in tracked changes); re‑run and capture short snippets demonstrating fixes; test with one peer and collect written feedback.
Session 2: Submission — students submit a single document with the initial prompt, change log (before/after snippets), tester feedback, the final prompt, and a short rationale of innovative choices.
In both modes, module leaders may supply a predefined scenario(s) to standardise scope and simplify marking. A ready‑to‑use example is provided in Appendix C.
Critical medical device supply chain — redundancy vs cost; equitable allocation.
Appendix A — Prompt template (simulation + debug‑ready):
Title: Complex Systems Simulator — [Scenario]
Purpose: Run a turn‑based interactive simulation of a complex sociotechnical system. Track named state variables, apply feedback and delays, and let the player’s decisions drive non‑linear outcomes.
Setup:
1) Offer three roles (distinct authority/constraints).
2) Introduce 3–5 NPCs with clear goals and plausible interventions.
3) Show a dashboard of [STATE_VARIABLES] each turn with short context.
State rules:
Track only these variables (with units/ranges): [list 5–8].
Maintain at least two feedback loops and one delay; keep hidden rule notes consistent across turns.
Each turn: recap; propose 3–5 options (plus free‑text); explain updates; show dashboard; request the following action.
Time step: 5 minutes to 1 week; end after 20–30 turns or on stop conditions.
Commands: status, talk [npc], inspect [asset], implement [policy], pilot [intervention], advance time, review log.
Debug commands (for testing): trace on/off (print update logic), why (state which loops/delays drove the change), show variables (print current state table), revert (roll back one turn), reseed (slight exogenous shock).
Realism and ethics: Allow all plausible actions and report consequences neutrally. If unsafe in the real world, refuse, propose safer alternatives, and continue with plausible systemic effects.
LLM pitfalls to avoid: Do not invent new variables; ask clarifying questions rather than guessing; keep outputs concise; summarise trajectory every five turns.
Begin: Greet the player, state the scenario, ask for a role, and wait.
Appendix B — Debugging and play‑test checklist:
Functional coherence
Do state variables update consistently with declared logic?
Are reinforcing and balancing feedback identifiable in play?
Robustness
Does the simulation permit negative choices with realistic consequences?
Do trace/why explanations match outcomes?
Are stop conditions respected?
User experience and clarity
Are commands clear? Is turn pacing appropriate?
Are dashboards concise and informative?
Report
Provide three concrete defects with turn numbers, the prompt edits that fixed them, and evidence of the re‑run.
Appendix C — Predefined scenario (Urban Heatwave Response, UK city):
Boundary: One UK local authority area during the July–August heatwave period. Focus on public health, energy demand, and community resilience.
Roles: (1) Local Authority Resilience Lead; (2) NHS Trust Capacity Manager; (3) Distribution Network Operator (DNO) Duty Engineer.
Stakeholders: Residents (with a focus on vulnerable groups), care homes, schools, SMEs, DNO, local NHS Trust, emergency services, voluntary/community groups, Met Office (for alerts), and local media.
State variables (examples): Heat‑health alert level (0–4); Emergency Department occupancy (%); Electricity demand/capacity (% of peak); Indoor temperature exceedance hours (hrs > 27 °C); Public trust (0–100); Budget (£); Equity index (0–100).
Events/shocks: Red heat alert; substation fault; procurement delay; misinformation spike on social media; transport disruption; community centre cooling failure.
KPIs and stop conditions: Heat‑related admissions; unserved energy; cost variance; equity gap across wards. Stop if alert level 4 persists >3 days, budget overspends >10%, or trust <25.
Notes for assessors: Using a standard, predefined scenario simplifies marking and ensures comparable complexity across teams, while still allowing for diverse strategies and outcomes.
Any views, thoughts, and opinions expressed herein are solely that of the author(s) and do not necessarily reflect the views, opinions, policies, or position of the Engineering Professors’ Council or the Toolkit sponsors and supporters.
Related INCOSE Competencies: Toolkit resources are designed to be applicable to any engineering discipline, but educators might find it useful to understand their alignment to competencies outlined by the International Council on Systems Engineering (INCOSE). The INCOSE Competency Framework provides a set of 37 competencies for Systems Engineering within a tailorable framework that provides guidance for practitioners and stakeholders to identify knowledge, skills, abilities and behaviours crucial to Systems Engineering effectiveness. A free spreadsheet version of the framework can be downloaded.
This resource relates to the Systems Thinking, Systems Modelling and Analysis, Ethics and Professionalism, Technical Leadership and Critical Thinking INCOSE Competencies.
AHEP4 mapping: This resource addresses several of the themes from the UK’s Accreditation of Higher Education Programmes fourth edition (AHEP4): Analytical Tools and Techniques (critical to the ability to model and solve problems), and Integrated / Systems Approach (essential to the solution of broadly-defined problems). In addition, this resource addressesAHEP themes of Design, Ethics and Communication.
Educational level: Intermediate; Advanced.
Learning and teaching notes:
The case is built around 3 × 90-minute sessions and independent report writing. A suggested breakdown of the activities can be seen below.
Learners have the opportunity to:
Explore how technical, human, and organisational factors interact in complex socio-technical systems.
Apply Fault Tree Analysis (FTA) to diagnose ambiguous real-world engineering failures.
Practice making judgements under uncertainty with incomplete and conflicting data.
Analyse competing stakeholder perspectives and the ethical trade-offs in engineering decision-making.
Develop professional communication skills by producing expert reports and presenting findings to a stakeholder panel.
Reflect on their own reasoning, assumptions, and handling of complexity.
Teachers have the opportunity to:
Use an authentic, narrative-driven case to introduce systems thinking and failure analysis.
Facilitate active learning through group FTA construction and peer review.
Engage students in interdisciplinary learning that links materials science, engineering practice, regulation, and ethics.
Adapt the complexity of the case (technical vs organisational) depending on learners’ level and course focus.
Provide formative and summative assessment using expert reports, presentations, and reflective writing.
Encourage metacognitive development by prompting students to examine uncertainty and assumptions in engineering practice.
20 min: Introduce case scenario and system context; 30 min: Group discussion on initial impressions, key stakeholders, and potential causes; 40 min: Begin Fault Tree Analysis (FTA) construction using initial evidence.
2
Investigation and analysis
30 min: Continue FTA construction and data evaluation; 30 min: Peer review of other groups’ fault trees; 30 min: Consolidate findings and prepare draft report outline.
3
Reporting and reflection
30 min: Present findings to a simulated stakeholder panel; 30 min: Discuss feedback and defend conclusions; 30 min: Individual reflection on complexity, uncertainty, and assumptions.
Summary of the system or context:
Rail transport systems consist of thousands of interdependent components, including rails, fasteners, sleepers, signalling systems, and maintenance processes. Failures in a single component can cascade, affecting:
Safety: Malfunctions may cause derailments or delays.
Economics: Service interruptions lead to financial losses and reputational damage.
Public trust: Media scrutiny increases scrutiny of operational practices.
On a cold January morning, a commuter train was halted after inspectors discovered a fractured rail joint component. Services were disrupted for several hours, stranding thousands of passengers. The media quickly picked up the story, raising questions about safety and reliability.
The rail operator urgently commissioned an engineering consultancy (the students) to investigate the failure. Their findings will inform both the safety authority’s decision on whether the line can reopen and the legal proceedings to determine liability.
The dilemma:
The operator demands a rapid report to resume services.
The manufacturer insists the component was produced to specification and blames poor maintenance.
The regulator requires an unbiased, defensible technical opinion before approving operations.
The public expects transparency and reassurance about safety.
As consultants, students face incomplete evidence: some lab tests are missing, inspection logs are inconsistent, and eyewitness accounts conflict. They must use Fault Tree Analysis (FTA) to map possible causes, evaluate data, and produce an expert opinion report — knowing that their conclusions could influence legal outcomes and public safety decisions.
Groups: 3–5 students per group; 3-4 groups can run in parallel.
Materials required: case narrative handouts, sample inspection log, example FTA, whiteboards/flipcharts, sticky notes for FTA mapping.
Activity flow:
1. Introduce case and assign roles.
2. Construct initial fault trees using evidence.
3. Peer-review across groups.
4. Draft expert report and present to simulated stakeholder panel.
5. Individual reflection on complexity and uncertainty.
Why use Fault Tree Analysis (FTA):
FTA is a structured approach to trace a failure from an observed event back to potential causes, including technical, human, and organisational factors.
FTA is particularly suitable for this case because it allows students to structure complex, uncertain information in a logical and transparent way. It helps them trace the chain of causes behind the rail component failure, linking material, human, and organisational factors into one coherent framework. By visualising how small events combine into system-level failures, FTA encourages learners to think critically about interdependencies, data gaps, and assumptions. It also mirrors real-world engineering investigations, where professionals must justify conclusions under uncertainty and demonstrate clear reasoning to stakeholders such as regulators or courts.
Visualises cause-effect relationships, interdependencies, and failure paths.
Encourages discussion of assumptions and uncertainties.
Questions and activities:
Discussion prompts:
Prompt
Expected insight / reflection
What technical, human, and organisational factors might have contributed to this failure?
Students identify multiple interacting factors, illustrating interdependencies and emergent risks.
How does Fault Tree Analysis help structure uncertainty in this investigation?
Learners recognise FTA’s role in visualising cause-effect pathways and clarifying assumptions.
Which assumptions are you forced to make, and how might they affect your conclusions?
Students reflect on data gaps, biased observations, and ethical implications of assumptions.
How do different stakeholders’ interests shape urgency and framing of your analysis?
Learners understand trade-offs, pressures from conflicting priorities, and the precautionary principle.
What are the risks of issuing a preliminary report under time pressure?
Students explore implications for safety, liability, professional integrity, and public trust.
Classroomactivities:
Activity
Focus
What “good practice” looks like
Facilitator notes / tips
1. FTA construction
Collaborative problem analysis
Teams discuss evidence openly, question assumptions, and co-create a logical tree linking technical, human, and organisational causes.
Encourage each group to identify at least one “human/organisational” branch and to label any data gaps explicitly.
2. Peer review
Critical reflection and systems perspective
Groups provide constructive critique, highlighting hidden assumptions, missing branches, or unclear logic. Dialogue stays professional and evidence-based.
Provide coloured sticky notes or digital comments to record feedback; model how to frame critique as questions (“Have you considered…?”).
3. Report writing (in-class drafting)
Synthesis and professional communication
Drafts show a clear, defensible reasoning chain from evidence to conclusion. Teams justify assumptions and note uncertainties.
Remind students to separate “facts” from “interpretations.” Encourage use of structured headings (Findings – Analysis – Conclusions).
4. Simulation role-Play
Perspective-taking and communication under pressure
Presentations are concise (≤5 min), factual, and adapted to stakeholder roles. Learners respond respectfully and clearly to challenging questions.
Provide role cards for the panel (operator, regulator, manufacturer, public). Rotate students if possible.
5. Reflection
Metacognition and learning from uncertainty
Students identify what surprised them, what they found ambiguous, and how their view of engineering judgment evolved.
Offer prompts like “What would you do differently next time?” or “Where did your reasoning feel uncertain?”
Further challenge:
Instructors may choose to introduce a second “reveal” phase: a new metallurgical test result or a whistle-blower statement emerges halfway through the case. Students must revise their fault tree and defend whether and how their conclusions change. This highlights the evolving nature of complex systems investigations.
Assessment opportunities:
Fault Tree Diagram (30%) – accuracy, depth, clarity.
Presentation and defence (20%) – clarity, stakeholder awareness, handling questions.
Reflective summary (20%) – insight into uncertainty, assumptions, systems thinking.
Any views, thoughts, and opinions expressed herein are solely that of the author(s) and do not necessarily reflect the views, opinions, policies, or position of the Engineering Professors’ Council or the Toolkit sponsors and supporters.
 Peter Martin, Director of Research & Development at Quanser, and co-chair of the Complex Systems Toolkit Working Group, reflects on the importance of engineers understanding complex systems when working in the field of intelligent robotics.