Digital engineering tools or modelling or simulation
Peter Martin, Director of Research & Development at Quanser, and co-chair of the Complex Systems Toolkit Working Group, reflects on the importance of engineers understanding complex systems when working in the field of intelligent robotics.
“In late 2024 I had the opportunity to join the EPC Complex Systems Toolkit team as co-chair of the working group. At the time I felt a little fraudulent, as the intricacies of complex systems thinking was new to me. I had brushed up against complex systems numerous times over the years as I had studied and worked in the world of robotics for over 20 years. However, I had never discovered the world of formal complex systems analysis. Looking back, this is a perfect validation for the need to create a toolkit to better prepare students for careers like mine. As I have learned more over the last 18 months about the tools and techniques that systems engineers employ to model and manage complexity, the critical value that these techniques offer engineers in the world of intelligent robotics has become obvious. As we hear often in the field of engineering lab equipment for the academic space, “I wish I’d had this when I was at university”.
The other reassuring aspect of my experience, for me, is that I’m not alone. A growing need for better approaches to managing complexity has emerged in industry over the last couple of decades as robotics and their governing systems have become increasingly integrated into society. This transition of robotics out of the structured environment of the factory floor and into direct contact with both the dynamic and unstructured world and the public, has introduced a high degree of non-linear predictability, complex interactions with multiple robotic agents, and emergent behaviours as the decision-making algorithms that dictate robotic behaviour adapt. All of these elements are central to the world of complex systems analysis.
At a high level, modern robotics systems no longer represent technical engineering challenges in the narrow, discipline-specific sense that engineers would traditionally have seen in higher education. They are complex adaptive systems that routinely demonstrate behaviours that emerge from interactions with their environment rather than being fully specified in advance. A robot navigating a hospital corridor, a swarm coordinating warehouse logistics, or a surgical assistant adjusting in real time to tissue variability represent challenges in undefined, non-linear, and largely unpredictable spaces. Students, and later robotics engineers who lack a complex systems vocabulary are essentially tasked with trying to understand emergence without the tools to describe it.
An example that I like to use is one that we encountered a couple of years ago: a team of mobile robots transporting parts around a manufacturing space. In many cases, the agents (ground robots, arms, etc.) in this scenario are programmed with independent control and decision-making code to govern their behaviour, with some overarching supervisory code to manage tasks and assignments. The ground robots would have algorithms to localise, path plan, navigate, and avoid obstacles while communicating with other complementary agents and central task management. However, as I have learned, complexity lies in the emergence of unexpected interactions between the agents and their environment. How they avoid each other and the environment while achieving their tasks is largely a complex non-linear system where conflicts can routinely delay or disrupt their operation. Introducing more sources of disruption such as humans, unstructured environments, weather conditions etc. only makes dealing with unpredictable scenarios more and more complicated using traditional techniques.
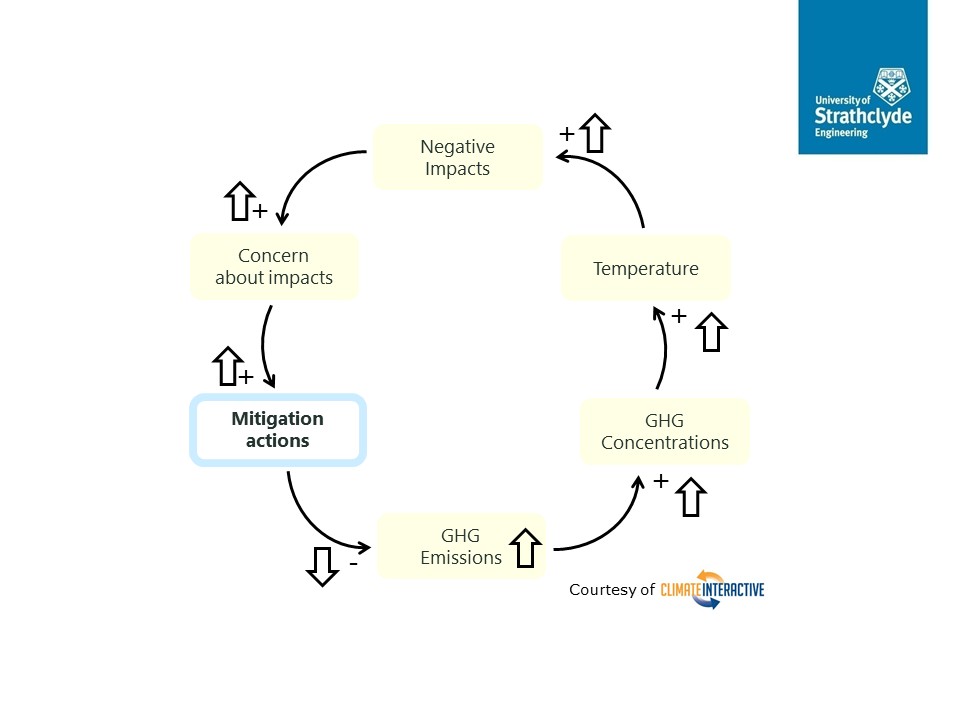
Luckily, many of the tools and techniques that are highlighted in the toolkit have direct applications to the challenges faced by engineers in the world of robotics. Causal Loop Diagrams (CLDs) are an excellent way to model the feedback dynamics that are at play in adaptive control systems. When a robot’s perception system updates its world model based on changes in what the sensors can perceive, that leads to changes in its action policy that when executed create a feedback loop. These diagrams are a great way to visualise and analyse these loops. Agent-Based Modelling (ABM) is directly relevant to the scenario I described above where swarms of robot must be coordinated or manage human-robot interaction scenarios. Using these simulation tools, engineers can test and manage emergent fleet behaviour without hardware. If things do go sideways, Fault Tree Analysis is a common approach to mapping causes and evaluating data to help develop robots that work in safety-critical applications. Finally, for long-term operations such as field robotics missions, Systems Dynamics Modelling can be a useful tool for predicting and managing a robot’s resource consumption (battery, compute, bandwidth) depending on the required task performance over time.
In addition to these considerations, there is a whole world of network modelling and the management of behaviour stemming from machine learning and applied AI algorithms that also overlaps quite closely with complex systems. Engineers that understand emergence, feedback loops, and attractors are far better equipped to reason about why a robot does something unexpected, than students who only have a component-driven technical understanding of the behaviour of an intelligent robot. Beyond the decisions, at an actual component level there are critical decisions that need to be made for efficient deployment of physical and edge AI algorithms. What data is processed locally and what goes to the cloud, when models are updated and how decision making is distributed across a robot swarm are exactly the kind of questions that systems thinking trains engineers to answer. Systems tools are ready to help, including influence diagrams to manage information exchange and action planning.
Overall, the field of complex systems introduces a set of tools, techniques, and mental models that are increasingly essential to robotics engineers that seek to prepare their agents to be effective in performing complicated tasks in increasingly complex systems.”
Intelligent robotics, and the more recent applications to physical AI, generally refers to artificial intelligence systems that are embedded in and interact directly with the physical world, rather than operating purely in digital environments. For engineering students, learning about intelligent robotics and physical AI workflows matters because it sits at the intersection of software, hardware, and real-world problem solving. It helps engineers think holistically: not just “does the code work?” but “does the system behave safely and effectively in the real world?”.
We are seeking experts in intelligent robotics, from academia, industry, and engineering organisations, to develop resources on this topic for publication in the Toolkit. These resources will inform, guide and aid educators to embed teaching on intelligent robotics into their engineering lessons, modules or courses.
Any views, thoughts, and opinions expressed herein are solely that of the author(s) and do not necessarily reflect the views, opinions, policies, or position of the Engineering Professors’ Council or the Toolkit sponsors and supporters.
Related INCOSE Competencies: Toolkit resources are designed to be applicable to any engineering discipline, but educators might find it useful to understand their alignment to competencies outlined by the International Council on Systems Engineering (INCOSE). The INCOSE Competency Framework provides a set of 37 competencies for Systems Engineering within a tailorable framework that provides guidance for practitioners and stakeholders to identify knowledge, skills, abilities and behaviours crucial to Systems Engineering effectiveness. A free spreadsheet version of the framework can be downloaded.
This resource relates to the Systems Thinking, Systems Modelling and Analysis, Integration, and Technical Leadership INCOSE competencies.
AHEP4 mapping: This resource addresses several of the themes from the UK’s Accreditation of Higher Education Programmes fourth edition (AHEP4): Analytical Tools and Techniques (critical to the ability to model and solve problems), and Integrated / Systems Approach (essential to the solution of broadly-defined problems).
Educational level: Beginner; Intermediate.
Learning and teaching notes:
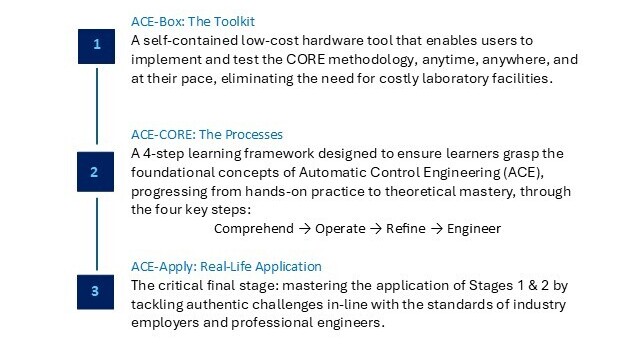
Modern engineering is increasingly digital, interconnected, and system oriented. To prepare students for this evolving landscape, the Automatic Control Engineering (ACE) Model offers a systems-driven, application-focused framework for practical control engineering education. Developed through a MathWorks-funded project launched in the summer of 2025, the ACE-Model unifies three complementary components that together cultivate systems thinking and model-based systems engineering competence:
ACE-Box: The Toolkit
ACE-CORE: The Processes
ACE-Apply: Real-World Application
Learners have the opportunity to:
Engage with the entire ACE-CORE (Comprehend – Operate – Refine – Engineer) framework.
Experience a welcoming and accessible introduction to ACE, without an early overemphasis on mathematics. This stands in contrast to the traditional approach, where topics such as Laplace transforms are introduced early on, often creating unnecessary barriers to engagement (Abou-Hayt and Dahl, 2023).
Develop systems awareness and motivation.
Develop confidence, engagement, and curiosity.
Gain the technical knowledge and systems integration mindset required to thrive in the complex, adaptive landscape of digital engineering.
Teachers have the opportunity to:
Introduce control theory topics in a way that addresses the concern of students finding it difficult to link abstract control theory with the world of control engineering practice(Rossiter, 2022; Badau, et al., 2024).
Introduce industry-standard systems processes such as the V-diagram and model-based design workflows.
Progressively link theory to practice.
Support AHEP4 expectations for developing graduates who can apply integrated systems approaches to solving complex problems and the INCOSE Systems Engineering Competency areas of systems thinking, integration, and technical leadership.
What does the ACE-Model consist of?:
Figure 1:The ACE-Model: Integrating the Toolkit (ACE-Box), with the Processes (ACE-CORE), to Lead to the Real-Life Application (ACE-Apply) to build a progressive mastery in Automatic Control Engineering (ACE).
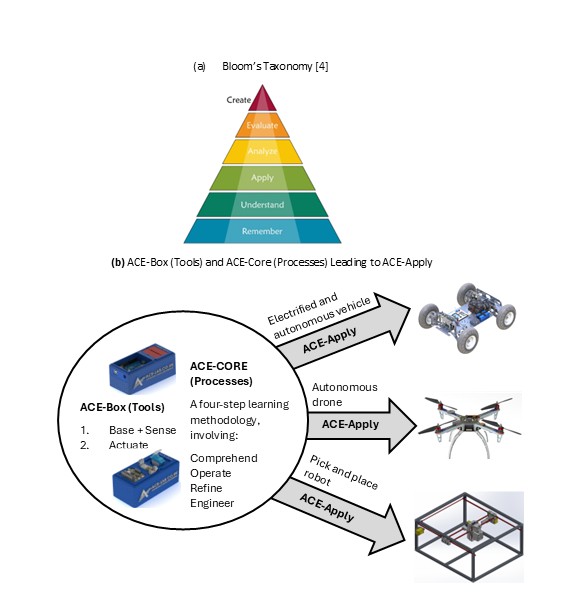
The ACE-Model is closely aligned with Bloom’s Taxonomy, see (Anderson and Krathwohl, 2001)and Figure 2(a) providing a structured pathway for students to progress through the cognitive hierarchy, while developing capabilities across multiple levels of system abstraction. Figure 2(b) offers a schematic view of the three stages of the ACE-Model, as introduced in Figure 1. An initial overview of the ACE-Model is presented here, with further details provided in the following sections.
The ACE-Box is a portable, self-contained hardware tool that brings ACE to life beyond the traditional costly, full-scale laboratories. All that is required is a laptop and the ACE-Box. Designed to support the ACE-CORE methodology, ACE-Box can be set up on a desk, in a classroom, or even at home. MATLAB and Simulink serve as the primary platforms for model-based design, enabling system modelling, control system development, and the deployment of control algorithms to physical hardware (e.g. Arduino Uno) through code generation tools.
ACE-CORE guides learners through successive levels of Bloom’s framework:
Comprehend aligns with Remember and Understand on the Bloom Taxonomy, enabling students to grasp the applications of control engineering before advancing.
Operate corresponds to Apply on the Bloom Taxonomy, as students engage directly with control systems, supported by Stage 2, making use of the ACE-Box (hardware or virtual).
Refine maps to both Analyse and Evaluate on the Bloom Taxonomy, where learners diagnose performance, compare outcomes, and adapt solutions to meet stakeholder requirements.
Engineer extends this process to system-level design and synthesis, making use of modelling and simulation tools such as MATLAB and Simulink. At this stage, students revisit the full cycle (Remember through to Evaluate), but at a higher level of integration with the use of control theory, again supported by the ACE-Box.
At each stage of CORE, learners move from recognising system components to synthesising complex interactions, mirroring the systems engineering lifecycle from requirement capture through verification and validation. This alignment supports AHEP4’s emphasis on analytical and problem-solving competence and INCOSE’s System Definition and Integration competencies.
Finally, learners progress to Create, the highest stage of Bloom’s Taxonomy, by applying their knowledge to design complete control systems for real-world applications such as drones, vehicles, and automation systems. In this way, the ACE-Model scaffolds learning in parallel with Bloom’s progression, from foundational comprehension to advanced problem-solving, design and innovation.
Together, these three pillars form a cohesive learning ecosystem: the toolkit, the process, and the application.
Figure 2:Bloom’s Taxonomy (Anderson and Krathwohl, 2001)(a) and the ACE-Model Three Stages (b).
Collaborative community:
The ACE-Model ‘sits’ within the ACE-Lab, a collaborative community of academics and industry professionals committed to developing, validating, and disseminating open-access systems education resources. The ACE-Lab approach embodies complex adaptive systems principles, where the community evolves through continuous feedback, iteration, and co-design. Membership to the ACE-Lab is open to anyone who shares our vision of advancing control engineering teaching tools and practices. Through this approach, the ACE-Model equips graduates with the knowledge and hands-on skills required to excel in modern ACE careers. Find out more about the ACE-Lab through the following website:www.ace-lab.co.uk
As an evolving community, ACE-Lab continually expands its open-access content through the active contributions of its members. New materials are regularly developed and shared, ensuring the resources remain current and relevant. Through this dynamic, collaborative approach, embodied in the ACE-Model, students not only gain technical knowledge but also develop the capacity to understand, navigate, and work effectively with complex, interconnected engineering systems.
ACE-Box: The toolkit:
The ACE-Box is based on the early development work of Control-Lab-in-a-Box(Pickering, 2023; 2025). CLB integrates sensors, actuators, and microcontroller to allow students to experience dynamic behaviour, and feedback control.
For now, two ACE-Box kits have been developed:
1. Base and sense
2. Actuate
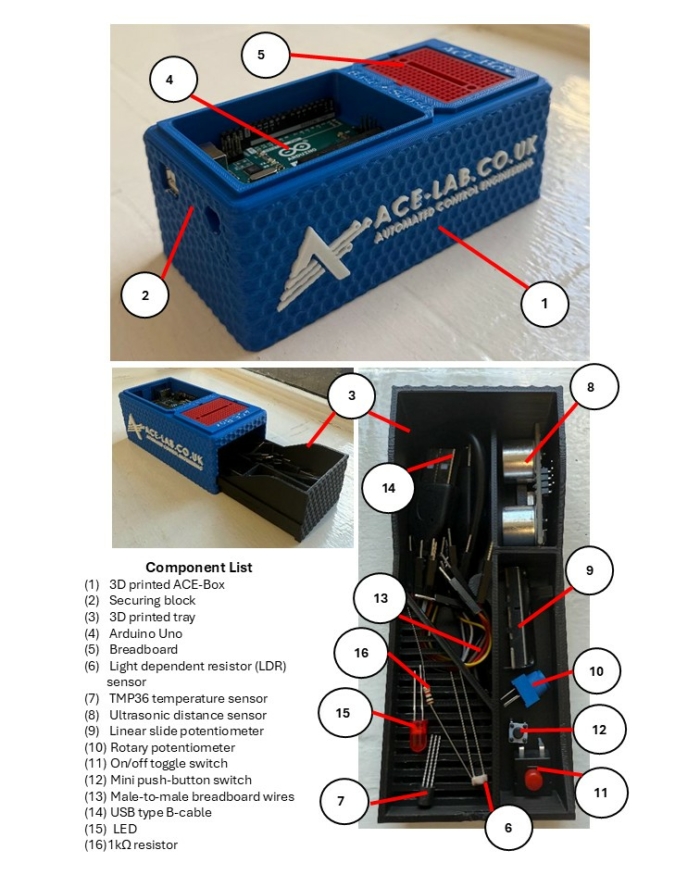
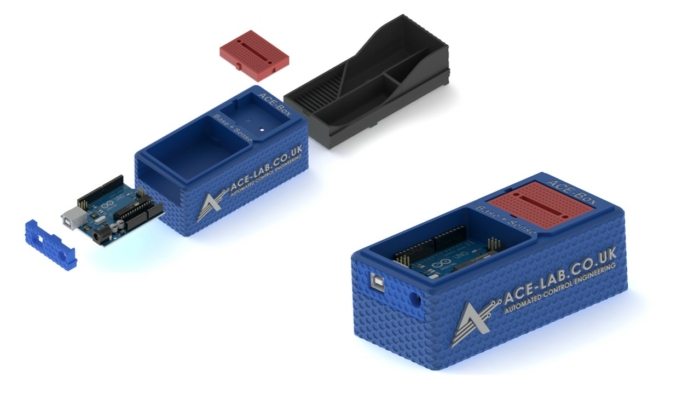
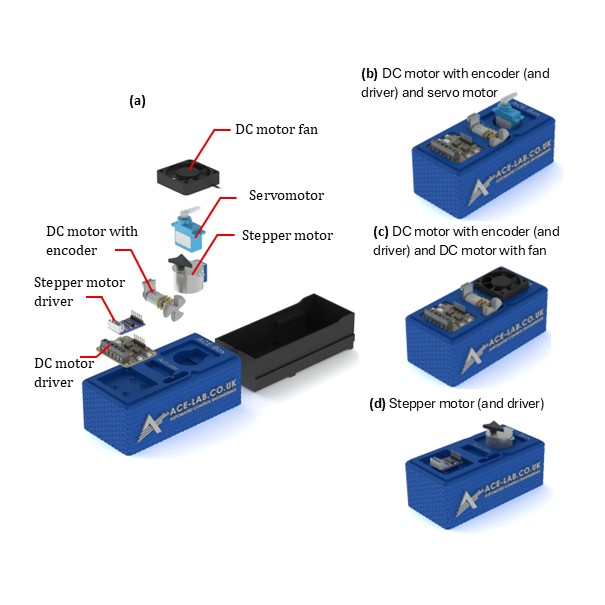
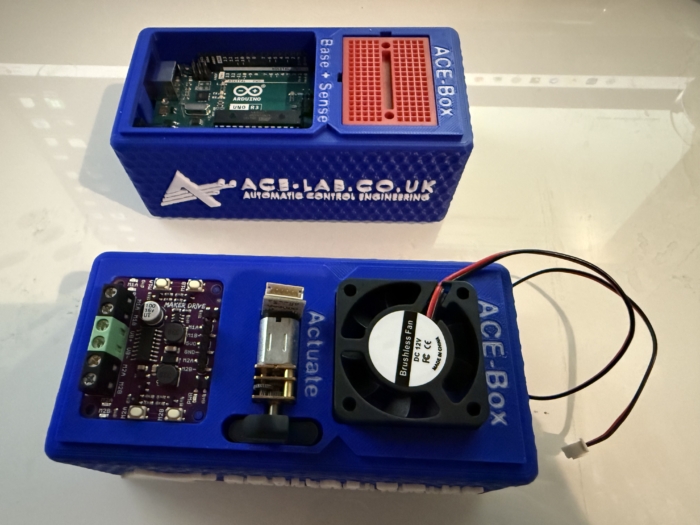
The ACE-Box (base and sense) is illustrated in Figure 3, with the 15 key components labelled, along with an exploded view of the main parts in Figure 4. The ACE-Boxesintegrate the essential microcontrollers, electronics, sensors, and actuators needed to design, implement, and test elements of digital control algorithm development, e.g. control algorithms in real time. It bridges the gap between theory and practice, allowing learners to see how abstract concepts behave in physical systems. The ACE-Box is also available as an open-access resource, with laboratory exercises included, with details provided later in this article. The ACE-Box (labelled (1) in Figure 3) and the tray (labelled (2) in Figure 3) are manufactured using 3D printing, with the necessary files available on the project website referenced above. A list of the required components and their sources is also provided on the project website, corresponding to labels (3) to (15) in Figure 3. Due to the open-source design of ACE-Lab, the library of exercises will continue to expand, supported by contributions from both academia and industry. The ACE-Box (Actuate) is illustrated in Figure 5, with the key actuator components detailed in (a), along with some typical lab set-ups (b, c and d). Figure 6 illustrates both the ACE-Box (Base + Sense) and also ACE-Box (Actuate).
Figure 3:The ACE-Box (Base and Sense).
Figure 4: Assemble of the 3D Printed ACE-Box (Base and Sense).
Figure 5:The ACE-Box (Actuate).
Figure 6:ACE-Box (Actuate) Alongside the ACE-Box (Base + Sense).
ACE-CORE: The methodology:
ACE-CORE is a four-step framework designed to scaffold learning from components to system-of-systems understanding:
Comprehend: Recognise the interdependencies between components within a feedback control system.
Operate: Discover how to operate a control system from understanding system requirements to testing and validation.
Refine: Diagnose, analyse, and optimise performance using feedback principles; students apply system verification and validation approaches.
Engineer: Apply mathematics and modelling to synthesise control algorithms and architectures that achieve desired system behaviours.
The methodology explicitly develops systems thinking, and integrationcompetencies, core to both AHEP4 and INCOSE frameworks.
ACE-CORE is intentionally designed to offer a scaffolded learning experience, allowing students to build confidence step by step as they deepen their understanding. Due to its flexible structure, students can also follow a completely practical route, i.e. avoiding the modelling and simulation. The emphasis is not on rote memorisation of theory, but on progression through understanding the fundamentals of control engineering, e.g. the components that form a feedback control system.These routes enable learners to apply concepts in practical control engineering contexts and develop genuine competence.
ACE-Apply: Real-world application:
ACE-Apply is the project stage, where the skills and knowledge gained from ACE-Box and ACE-CORE are consolidated by tackling authentic challenges aligned with the expectations of industry and professional engineers, see Figure 2(b). At this stage, learners prove their mastery by addressing engineering application problems that reflect the standards of industry practice. The focus is on:
Applying the ACE-CORE methodology to practical control application challenges across domains such as robotics, automotive systems, drones, and industrial automation.
Bridging theory, simulation, and hardware with confidence and agility using industry standard tools and processes.
This stage reinforces AHEP4 Themes 3 and 5, particularly:
Applying integrated systems approaches to complex, real-world problems.
Managing system lifecycle activities including requirements capture, design, testing, and validation.
It also strengthens INCOSE competencies in System Realisation, Integration, and Technical Project Management, encouraging students to act as systems integrators capable of managing interfaces and dependencies across mechanical, electrical, and software domains.
By bridging theory, simulation, and hardware using industry-standard digital tools, ACE-Apply nurtures the ability to navigate complex adaptive systems, anticipate emergent behaviour, and work collaboratively within multidisciplinary engineering ecosystems.
ACE-Box activities:
Upon visiting the ACE-Lab website (www.ace-lab.co.uk), under the tab ‘ACE-Box’, the following tabs exist (with the links provided):
The “What is the ACE-Box?” page introduces educators and students to the ACE-Box platform, outlining its purpose, key features, and practical considerations such as sourcing components and 3D-printing enclosure parts.
The “Prior Exercises” page provides essential onboarding material designed to help users become familiar with MATLAB and Simulink. This includes links to the relevant OnRamp courses, guidance on installing the required software packages, and short tutorial videos that introduce the MATLAB and Simulink graphical user interfaces (GUIs).
The “Base + Sense” section contains a set of introductory tutorial exercises that use the ACE-Box (Base + Sense configuration). These activities help users get started with Simulink code generation for the Arduino Uno, while working with a range of basic sensors and electronic components.
Finally, the “Base + Sense + Actuate” section builds on the previous material by introducing actuation hardware. Using both the Base + Sense and Actuate modules, students and educators learn how to interface with and control devices such as DC motors, servomotors, and stepper motors. This section is designed to familiarise users with actuator integration and reinforce practical control engineering workflows.
Example use of ACE-Box (Base + Sense):
To demonstrate the use of the ACE-Box (Base + Sense), an introductory activity is provided, i.e. the on-off blinking of an LED. Prior to this activity, through ACE-CORE, students should receive a short introduction to microcontrollers covering key concepts such as digital input/output pins, analogue pins, and pulse-width modulation (PWM). Once students are familiar with these fundamentals, they progress to the initial exercise detailed here, which is aligned with defined learning outcomes.
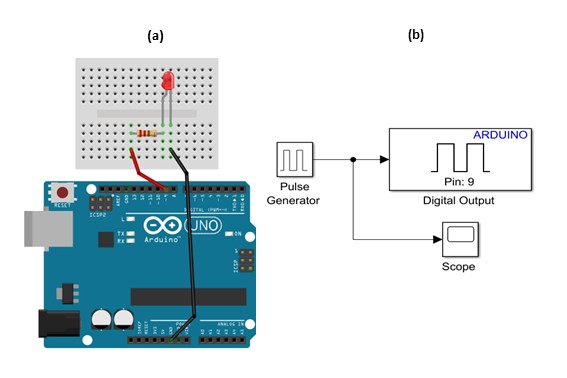
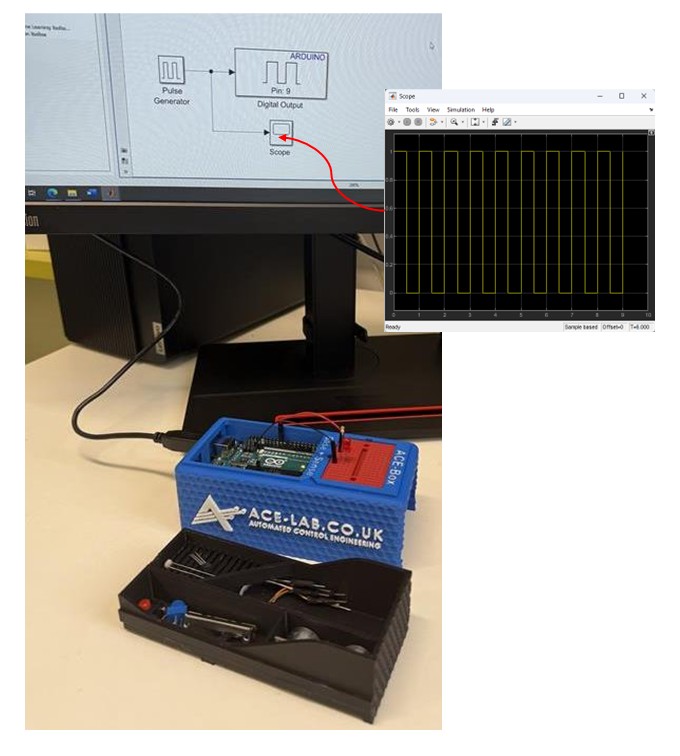
Since MATLAB and Simulink are the primary software tools used with the ACE-Box, students are first guided through installing the Simulink Support Package for Arduino Hardware. After the hardware and software setup is complete, they assemble a simple circuit, see Figure 7(a), and configure a Simulink model for the first exercise, see Figure 6(b). This initial activity requires students to control the state of a digital output pin on the Arduino, switching it on and off. The Simulink model, provided in Figure 7(b), enables students to quickly build the exercise using a visual programming approach. To run the activity, they follow a sequence of steps that includes code generation, which compiles the Simulink model into embedded C code and deploys it onto the Arduino Uno microcontroller. Once completed, the LED connected to the circuit blinks on and off according to the settings of the Simulink pulse generator. A visual of the complete set-up for this initial exercise can be found in Figure 8. At this stage, students are encouraged to experiment with the pulse generator parameters in real-time, observing how changes to the signal properties immediately affect the LED’s behaviour. Scopes can also be used (see Figure 7(b)) to visualise the pulse generator’s square-wave output, including its amplitude, period, and pulse width. This hands-on interaction reinforces the link between the initial set-up and hardware implementation while deepening their understanding of microcontrollers.
Figure 7:LED Simple Circuit (a) and Simulink for Code Generation for the on-off Blinking of an LED.
Figure 8:LED Simple Circuit Set-Up using Simulink for Code Generation for on-off Blinking of an LED.
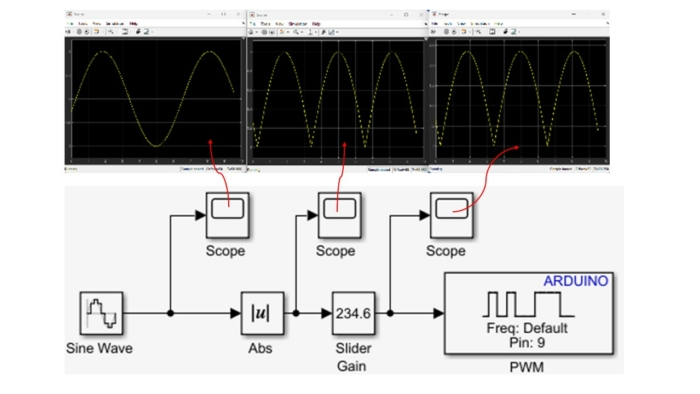
The initial exercise is designed to familiarise students with the ACE-Box and the use of Simulink’s code generation tools. This type of activity is typical for introducing students to a new software and hardware environment. The next exercise involves using pulse width modulation (PWM) to vary the brightness of the LED. This exercise involves using additional blocks in Simulink, see Figure 8, where multiple scopes are used to visualise the signals in real-time. Once students understand the fundamental building blocks of Simulink, they can quickly progress to developing feedback control systems that meet a variety of application requirements. In the authors’ view, student familiarity with Simulink makes it a more accessible platform for designing advanced control algorithms, particularly when working with sub-systems.
Figure 9:LED Simple Circuit Set-Up using Simulink for Code Generation Varying Brightness of an LED using Pulse Width Modulation (PWM).
Building on this foundation, a wide range of laboratory exercises can be developed using the electronic components involved in ACE-Box (Base + Sense), as illustrated in Figure 3, with the option to expand further by incorporating additional components. Examples of extended exercises include:
Analogue sensing and calibration with a temperature sensor
LDR characterisation and linearisation using a voltage divider
Analogue sensing and calibration with a potentiometer sensor
Digital sensing using an ultrasonic sensor
Distance-reactive LED control with proportional feedback (human-in-the-loop plant)
Closed-loop brightness control using LDR feedback and LED PWM
LED–LDR plant control experiments
In addition to sensing activities, the ACE-Box (Actuate) provides four actuators: a servomotor, a DC motor with encoder, a stepper motor, and a DC motor fan. This unit can be used independently or in combination with the Base and Sense ACE-Box to enable more advanced control experiments, such as DC motor speed control or motor control based on light intensity measurements from an LDR.
The flexibility of the ACE-Box system ensures that the number of possible exercises is effectively unlimited, as new experiments can be designed by combining existing sensors and actuators or by integrating additional measurement devices. This also allows unique coursework assignments to be created.
Summary:
The ACE-Model provides a systemic and holistic framework for practical control engineering education that:
Fosters systems thinking and model-based design literacy aligned with INCOSE and AHEP4 competencies.
Connects abstract control theory to complex, real-world systems through accessible hands-on experiences.
Encourages progression from component-level comprehension to system integration.
Builds confidence and motivation through authentic engagement with digital and physical systems, preparing graduates for engineering practice in a complex, interconnected world.
Acknowledgements:
Dr James E. Pickering gratefully acknowledges the support from MathWorks, whose funding made this project possible. He also extends his sincere thanks to Hari Sudeskkumar for his exceptional engineering design contributions and 3D-printing work. The authors would like to thank the Project Advisory Group (PAG) for their valuable guidance throughout the development of this work.
References:
Abou-Hayt, I. and Dahl, B., 2023. A Critical Look at the Laplace Transform Method in Engineering Education. IEEE Transactions on Education, 67(4), pp.542-549.
Anderson, L.W. and Krathwohl, D.R., 2001. A taxonomy for learning, teaching, and assessing: A revision of Bloom’s taxonomy of educational objectives: complete edition. Addison Wesley Longman, Inc..
Badau, N.E., Popescu, T.M., Mihai, M., Dulf, E.H. and Muresan, C.I., 2024. Bridging the gap between control theory and practice: From simple controller design to a practical microcontroller implementation. IFAC-PapersOnLine, 58(26), pp.124-129.
Pickering, J.E., 2023. Control-Lab-in-a-Box: Bridging the Gap between Control Theory and Engineering Practice. In UK and Ireland Engineering Education Research Network Conference Proceedings 2023.
Pickering, J.E., 2025. Leveraging Control-Lab-in-Box (CLB) to Teach Control Engineering on Future Vehicle Technologies MSc. IFAC-PapersOnLine, 59(7), pp.31-35.
Rossiter, J.A., 2022. Future trends for a first course in control engineering. Frontiers in Control Engineering, 3, p.956665.
Any views, thoughts, and opinions expressed herein are solely that of the author(s) and do not necessarily reflect the views, opinions, policies, or position of the Engineering Professors’ Council or the Toolkit sponsors and supporters.
Downloads: A PDF of this resource will be available soon.
Related INCOSE Competencies: Toolkit resources are designed to be applicable to any engineering discipline, but educators might find it useful to understand their alignment to competencies outlined by the International Council on Systems Engineering (INCOSE). The INCOSE Competency Framework provides a set of 37 competencies for Systems Engineering within a tailorable framework that provides guidance for practitioners and stakeholders to identify knowledge, skills, abilities and behaviours crucial to Systems Engineering effectiveness. A free spreadsheet version of the framework can be downloaded.
This resource relates to the Systems Thinking, Systems Modelling and Analysis, Configuration Management, Requirements Definition, Communication, Verification, and Validation INCOSE Competencies.
AHEP4 mapping: This resource addresses several of the themes from the UK’s Accreditation of Higher Education Programmes fourth edition (AHEP4):Analytical Tools and Techniques (critical to the ability to model and solve problems), and Integrated / Systems Approach (essential to the solution of broadly-defined problems). In addition, this resource addresses the themes of Sustainability and Communication.
Educational level: Advanced.
Learning and teaching notes:
Overview:
This multi-part case study guides students through the complex systems challenges of Prince Edward Island, Canada’s ambitious 100% renewable energy transition by 2030. Students will experience how technical, social, and economic factors interact through emergence, feedback loops, and multi-scale dynamics that traditional engineering analysis alone cannot capture.
Learners have the opportunity to:
Identify complex systems characteristics (emergence, feedback loops, nonlinearity) in real energy systems.
Apply multiple modelling approaches (ABM, system dynamics, network analysis) to analyse system behaviour.
Evaluate how technical decisions create emergent social and economic consequences.
Synthesise insights from different modelling approaches to inform policy recommendations.
Communicate complex systems concepts and uncertainties to non-technical stakeholders.
Teachers have the opportunity to:
Demonstrate complex systems concepts through hands-on modelling.
Facilitate discussions on emergence and system-level behaviours.
Evaluate learners’ ability to apply systems thinking to engineering problems.
Connect technical modelling to real-world policy and social implications.
Overview: Energy transition as a complex systems challenge:
Prince Edward Island (PEI), Canada’s smallest province, aims to achieve 100% renewable electricity by 2030. Its small grid, dependence on imported power, and growing renewable infrastructure make it a natural laboratory for systems thinking in energy transitions.
This case invites students to explore how technical, social, and policy decisions interact to shape renewable integration outcomes. Using complexity-science tools, they will uncover how local actions produce emergent system behaviour, and why traditional linear models often fail to predict real-world dynamics.
The complex challenge: Traditional engineering approaches often treat energy systems as predictable and linear, optimising components like generation, transmission, or storage in isolation. However, energy transitions are complex socio-technical systems, characterised by feedback loops, interdependencies, and emergent behaviours.
In PEI’s case, replacing stable baseload imports with variable wind and solar generation creates cascading effects on grid stability, pricing, storage demand, and social acceptance. The island’s bounded geography magnifies these interactions, making it an ideal context to observe emergence and system-level behaviour arising from local interactions.
PEI currently imports about 75% of its electricity via two 180 MW submarine cables, while 25% is produced locally through onshore wind farms (204 MW). Plans for offshore wind, community solar, and hydrogen projects have triggered debates around stability, affordability, and social acceptance.
Taking on the role of an engineer at TechnoGrid Consulting, students are tasked to advise Maritime Electric, the island’s utility, on modelling strategies to guide $2.5 billion in renewable investments.
Competing goals:
Maintain grid reliability while replacing fossil baseloads.
Achieve policy targets without increasing public resistance.
Balance economic cost, environmental benefit, and technological feasibility.
Discussion prompt:
In systems terms, where do you see tensions between policy, technology, and society? How might feedback loops amplify or mitigate these tensions?
While Maritime Electric’s engineering team insists the project scope should stay strictly technical, limited to grid hardware, generation, and storage, policy advisors argue that social behaviour, market pricing, and community engagement are part of the system’s real dynamics.
Expanding boundaries makes the model richer but harder to manage; narrowing them simplifies computation but risks missing the very factors that determine success.
Temporal boundaries: timescales from milliseconds (grid response) to decades (infrastructure).
Organisational boundaries: stakeholders, regulations, and markets.
Discuss how including or excluding elements (e.g., electric-vehicle uptake, community cooperatives, carbon policy) changes the model’s focus and meaning.
Learning insight:
Complex systems cannot be fully understood in isolation; boundaries are analytical choices that shape both perception and leverage. Every inclusion or exclusion reflects an assumption about what matters and that assumption determines which complexities emerge, and which stay hidden.
Part three: Modelling the system: Multiple lenses of complexity:
(a) Agent-Based Modelling (ABM) with NetLogo:
Students construct simplified models of households, businesses, and grid operators:
Household agents: decide to adopt rooftop solar based on payback time and neighbour influence.
Technology providers: adjust prices in response to market demand.
Grid operator: balances reliability and cost.
Emergent patterns such as adoption S-curves or network clustering illustrate how simple local rules generate complex collective dynamics.
(b) System Dynamics (SD) with Vensim:
Students then develop causal loop diagrams capturing key feedbacks:
Adoption–Learning Loop: installations ↓ costs ↓ encourage more adoption.
Cost–Acceptance Loop: higher bills ↓ public support ↓ investment capacity.
This provides a macroscopic view of feedback, delay, and leverage points.
(c) Network Analysis with Python (NetworkX):
Students model actor interdependencies: how households, utilities, industries, and regulators interact. Network metrics (centrality, clustering, connectivity) reveal where resilience or vulnerability is concentrated.
Reflection prompt:
Which modelling approach offered the most insight into system-level behaviour? What were the trade-offs in complexity and interpretability?
Part four: Scenario exploration: Pathways to 2030:
Students explore three transition scenarios, each with distinct emergent behaviours:
A. Distributed Solar + Community Storage
300 MW solar, 150 MWh batteries
Decentralised coordination challenges and social clustering effects.
B. Offshore Wind + Grid Enhancement
400 MW offshore wind, new 300 MW interconnection
Weather-dependent reliability and cross-border dependency.
Any views, thoughts, and opinions expressed herein are solely that of the author(s) and do not necessarily reflect the views, opinions, policies, or position of the Engineering Professors’ Council or the Toolkit sponsors and supporters.
Keywords: Systems thinking; System dynamics; Built environment; Causal loop diagrams; Participatory modelling; Modelling or simulation; Health or wellbeing; Cognitive map.
Related INCOSE Competencies: Toolkit resources are designed to be applicable to any engineering discipline, but educators might find it useful to understand their alignment to competencies outlined by the International Council on Systems Engineering (INCOSE). The INCOSE Competency Framework provides a set of 37 competencies for Systems Engineering within a tailorable framework that provides guidance for practitioners and stakeholders to identify knowledge, skills, abilities and behaviours crucial to Systems Engineering effectiveness. A free spreadsheet version of the framework can be downloaded.
This resource relates to the Systems Thinking, Systems Modelling and Analysis and Critical Thinking INCOSE competencies.
AHEP mapping: This resource addresses several of the themes from the UK’s Accreditation of Higher Education Programmes fourth edition (AHEP4): Analytical Tools and Techniques (critical to the ability to model and solve problems), and Integrated / Systems Approach (essential to the solution of broadly-defined problems). In addition, this resource addresses the AHEP themes of Design and Practical and workshop skills.
Educational level: Intermediate; Advanced.
Learning and teaching notes:
This activity is suitable for those having acquired some familiarity with complex systems and related concepts – especially causal loop diagrams, stock and flow diagrams, cognitive maps or participatory maps – who are looking for additional ideas for activities or who have a specific interest in participatory modelling. The activity is also useful at the point when students learn about interaction between different elements of a complex system or when they learn about the importance of human factors.
Learners have the opportunity to:
Deepen their understanding of systems thinking.
Engage with participatory modelling.
Enjoy a fun group activity.
Teachers have the opportunity to:
Introduce students to participatory modelling (i.e. more specifically to participatory system dynamics / group model-building).
Develop students’ understanding of stock-and-flow modelling in the tradition of system dynamics.
Support students’ understanding of complex interactions around urban dynamics, and if adapted also around other contexts.
This activity introduces students to a participatory systems thinking – or more specifically – participatory modelling exercise. This is an approach used in group settings to explore complex issues and represent them via models. In this activity, students assume the roles of stakeholders involved in an urban regeneration project and take part in a group model-building workshop.
It teaches students core principles of a participatory modelling method called group model-building or participatory system dynamics, but it can also be used to teach the underlying system structure of a specific phenomenon. This makes it well-suited for modules that contain elements of systems thinking and system dynamics (including causal loop diagramming and simulation modelling) or modules that contain an element on group facilitation and participatory methods.
The activity is designed to run over 1.5 to 2.5 hours and is adaptable. While the current example focuses on the phenomenon of urban dynamics around the population development in a city, the activity can be reframed using a case and model from a project management, water management, energy or other sustainability-related context.
The activity is directly aligned with systems thinking by immersing students in a participatory modelling process. It develops students’ awareness of system content and its interactions by teaching them qualitative modelling skills. It develops their skills in managing complexity and representing system elements with visual models consisting of items and their relationships depicted in causal loop diagrams and/or stock and flow diagrams. This serves to build students’ analysis skills and ability to apply systems approaches to problems. It also develops their practitioner, practical and workshop skills of collaborating with stakeholders. It does so by advancing their facilitation skills essential for collaborative systems work. This includes rules of conduct and techniques for managing a group discussion and group dynamics, making a broad range of ideas heard, prioritising them and mapping them visually.
Miro (free version available with up to three active boards)
MURAL or similar platforms (depending on institutional access)
If software or an online tool are used, these are used to collate concepts (variables suggested by students) and to build a diagram of their interactions. This will be projected to the in-person and/or online participants, replicating the participatory nature of in-person workshops.
Detailed explanation of the activity:
This activity introduces students to participatory modelling, an approach used in group settings to explore and understand complex issues and represent them via models. In this case, participatory modelling is introduced through a structured group model-building workshop, using a simplified version (Alfeld & Graham, 1976; Richardson, 2014) of Jay Forrester’s (1969) famous Urban Dynamics model, which sparked quite some debate because of its counter-intuitive insights. The session begins with a brief historical overview of urban growth and decline in major cities up to the 1980s (e.g. New York, Boston, London; see files under ‘Downloads’, above), before focusing on the London Docklands in London in 1981, as an example of an opportunity for urban redevelopment to counter the trend of population decline. Student groups are assigned stakeholder roles from that time, including the founder of the London Docklands Development Corporation (1–2 students), the Surrey Quays Housing Action Group (2–6 students), the London Chamber of Commerce (2–6 students) and the Greater London Council (2–6 students). Each student group receives a role sheet outlining their perspective and a small set of key variables relevant to their stakeholder position (see linked files). These variables are intentionally curated to align with the Urban Dynamics model and to ensure that collaboration is necessary to draw the interlinkages between the variables, i.e. the relevant system structure.
A list of variables provided to the student groups via the role sheets is included below. Note that not all variables that are necessary to draw the model are included; students need to infer a few variables to train their thinking.
London Docklands Development Corporation
Population (This is the total number of people living in the city. As the variable represents the sum of all people, it is an integral. Specific pictogram language can highlight this. In the tradition of system dynamics modelling, one would therefore put a rectangle around it, which the teacher can do after the variable has been placed on the board.)
Surrey Quays Housing Action Group
Housing Structures (Indicates the number of dwellings. Housing is important for urban development. As the variable represents the sum of all dwellings, it is also an integral, which would be depicted by a rectangle.)
Ratio of households to housing (This variable is an indicator of crowding. Ideally, there is one household per housing structure. A number above one means that some people need to live in shared places. A number below one means that there is vacant housing.)
London Chamber of Commerce
Business structures (Indicates the number of business units. Businesses are important to urban development. As the variable represents the sum of all business units, it is also an integral, which would be depicted by a rectangle.)
Jobs (Total number of jobs available in the city (whether filled or unfilled).
Greater London Council
Population (Repeated variable to be able to compare between groups.)
Net migration (Change in population. The simple model excludes population changes by births and deaths because of the relative larger changes by national and international migration.)
Jobs (Repeated variable to be able to compare between groups.)
Before the workshop begins, students are introduced to core concepts of participatory modelling (see linked slides), including facilitator roles (based on Richardson & Andersen, 1995) and common workshop scripts (e.g. hopes and fears, variable elicitation, voting, model building, policy option elicitation and system storytelling, as described in Scriptapedia and Andersen & Richardson, 1997).
The workshop proceeds in three main phases:
1. Variable elicitation: After a short introduction by the student playing the founder of the London Docklands Development Corporation into the setting and by the facilitator/teacher into the process, each group sketches behaviour-over-time graphs of their assigned variables (10 minutes). These are presented using a round-robin or nominal group technique, meaning one variable per group at a time only, and placed on a whiteboard/blackboard or digital canvas. The round-robin collection is a technique useful to foster inclusivity and avoid talking heads. Behaviour-over-time graphs rather than just variable names are useful because the final model is believed to explain a behavioural trend over time, linking model structure and dynamics. However, it is also possible to simplify by letting students just write the variable names on sheets of paper.
2. Voting and prioritisation: To decide on a starting point for modelling, each student votes on which variables they consider to be the most important to include in the model, e.g. giving the students as many votes as there are variables on the board and freedom of how to distribute their votes. While all variables will be included in the model, the voting activity provides a basis for reflection on different priorities and students’ personal vs. their group’s perspective, after the modelling activity.
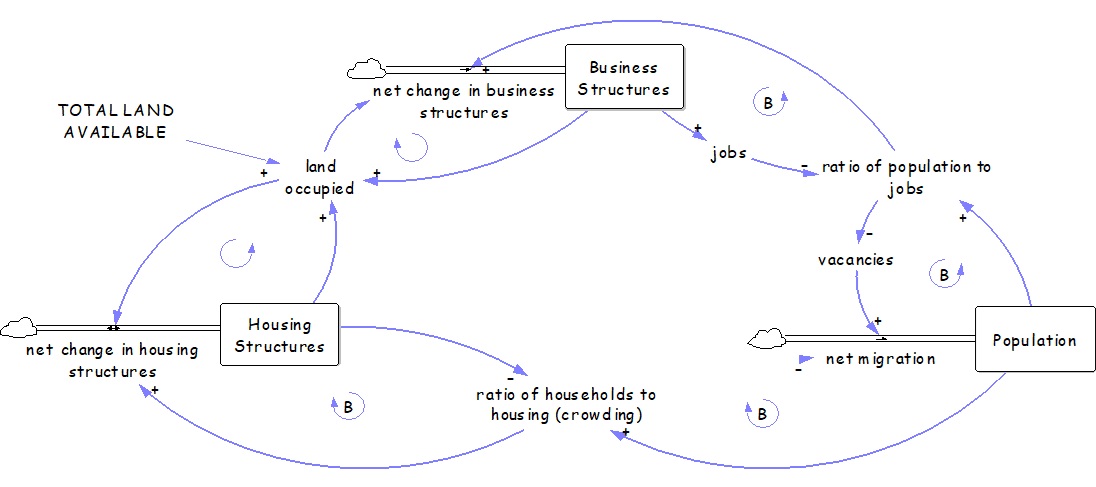
3. Model building: The class collaboratively constructs a stock and flow diagram (see Figure 1). Stocks such as Housing Structures, Business Structures, and Population are identified, and their net rates of change are discussed. To connect the variables, some more variables need to be added such as the ratio of population to jobs, total land available, and land occupied. To help students identify these variables, the teacher can ask questions: “Population and housing are linked by a ratio. What concepts and respective variables could link the other stocks?”. Students are encouraged to identify feedback loops and classify them as reinforcing or balancing.
It is useful to pay attention to uncovering less obvious relationships, such as the spatial competition between housing and business infrastructure. Once the diagram is complete, the facilitator reviews the model with the class, highlighting key feedback structures.
After the modelling activity, students can be shown images of the Docklands after the redevelopment as well as urban population trends of London and other major cities until today, prompting discussion on the long-term impacts of different types of development and prioritisation of a business vs. housing focus. The session can conclude with a reflection on the participatory process and its relevance to real-world decision-making and the value of participatory modelling in complex policy environments.
A more comprehensive version of this activity – including a more introductory group model-building exercise that teaches basic causal loop diagramming concepts and an alternative context using project management as an example – is available: https://discovery.ucl.ac.uk/id/eprint/10160261/
Figure 1: Stock and flow diagram of urban dynamics (produced with Vensim software). This figure is intended for educators and serves an illustrative purpose. It provides educators with a reference for how the model built during the activity is expected to look.
Note: The author was originally inspiredto focus on this case by the historical accounts found on the London Docklands Development Corporation (LDDC) History Pages (http://www.lddc-history.org.uk/index.html, nowinactive).
References:
Alfeld LE, & Graham AK. 1976. Introduction to Urban Dynamics. Cambridge, MA: Productivity Press.
Andersen DF, & Richardson GP. 1997. Scripts for group model building. System Dynamics Review 13(2): 107–129.
Antunes P, Stave K, Videira N, & Santos R. 2015. Using participatory system dynamics in environmental and sustainability dialogues. In M. Ruth (Ed.), Handbook of Research methods and Applications in Environmental Studies. Edward Elgar Publishing: Cheltenham, UK: 346–374.
Deaton M, & MacDonald R. 2025. System Dynamics Learning Guide. Harrisonburg, VA: James Madison University Libraries.
Zimmermann, N. 2026 (forthcoming). Weaving participatory modelling into teaching: Purposes and practices from system dynamics education. Systems Dynamics Review.
Any views, thoughts, and opinions expressed herein are solely that of the author(s) and do not necessarily reflect the views, opinions, policies, or position of the Engineering Professors’ Council or the Toolkit sponsors and supporters.
Keywords: Systems thinking; Problem-solving; Critical thinking; Digital literacy; Modelling and simulation; Design; Project management; Life cycle; Risk; Collaboration; Communication; Professional conduct; Social responsibility.
Downloads: A PDF of this resource will be available soon.
Learning and teaching resources:
Glossary: This article refers to many concepts and terms which are more fully described and explained in this companion resource.
Who is this article for?: Thisarticle should be read by educators at all levels in higher education who are seeking an overall perspective on teaching approaches for integrating complex systems in engineering education.
Related INCOSE Competencies: Toolkit resources are designed to be applicable to any engineering discipline, but educators might find it useful to understand their alignment to competencies outlined by the International Council on Systems Engineering (INCOSE). The INCOSE Competency Framework provides a set of 37 competencies for Systems Engineering within a tailorable framework that provides guidance for practitioners and stakeholders to identify knowledge, skills, abilities and behaviours crucial to Systems Engineering effectiveness. A free spreadsheet version of the framework can be downloaded.
This article outlines the core competencies required for engineering students to effectively engage with complex systems. Such systems involve a range of technical and non-technical components that interact in non-linear and unpredictable ways. Working effectively with such complex systems requires collaboration across engineering disciplines, as well as other fields and stakeholder groups.
Within AHEP4, complex problems are referred to as those which “have no obvious solution and may involve wide-ranging or conflicting technical issues and/or user needs that can be addressed through creativity and the resourceful application of engineering science” (p.26). The ability to work productively with complex systems is therefore essential for engineers and helps them address problems increasingly experienced in business and society, which have many interdependent components and lack clear or stable solutions.
The aim of this article is to provide a foundational framework that integrates the knowledge, skills and attitudes necessary for undergraduate and graduate engineering students to navigate complexity. In so doing, it serves educators, curriculum designers, and students seeking to develop the mindset and skills required to tackle the challenges of the 21st century within an increasingly volatile, uncertain, complex, and ambiguous (VUCA) world (SEFI, 2025).
This knowledge article, informed by the INCOSE Competency Framework for Systems Engineering (INCOSE, 2018), categorises complex systems competencies into eight core competencies. These competencies encompass mindset and foundations, technical methods and tools, management and delivery, and attributes and behaviours. The description of each competency references learning outcomes (LOs) outlined in AHEP4 (Engineering Council, 2025) and the International Engineering Alliance (IEA) Graduate Attributes (2021) to establish a common baseline for all engineering graduates (see Appendix for mapping).
The eight core complex systems competencies:
1. Systems thinking and problem framing
The ability to take a holistic approach, to consider a problem from multiple perspectives and to understand how a system’s parts interact to produce emergent behaviour.
Students must be able to understand what makes a system ‘complex’ and move beyond narrow problem-solving to identify root causes. This involves understanding fundamental Systems thinking concepts including hierarchies and interfaces (structural dimension), holism and cause-effect (dynamic dimension), lifecycles (time dimension), and multiple perspectives (perception dimension).
Systems thinking enables engineers to anticipate ripple effects, emergent behaviours, and trade-offs, designing solutions that remain robust under uncertainty. AHEP4 requires students to “formulate and analyse complex problems to reach substantiated conclusions” (LO2) and to “apply an integrated or systems approach to the solution of complex problems” (LO6).
2. Critical thinking
The ability to question assumptions, evaluate evidence, apply logical reasoning, and justify decisions based on reasoned arguments and evidence.
Navigating complex systems involves working with a variety of (often conflicting) goals, information, and data types from across discipline and stakeholder groups. Critical thinking is thus necessary to enable engineers to identify biases, avoid oversimplification and flawed reasoning, and to make ethical, transparent and evidence-informed decisions with consideration for unintended consequences. AHEP4 requires graduates to “critically evaluate technical literature and other sources of information to solve complex problems” (LO4).
3. Simulation, modelling and data literacy
The ability to apply scientific, mathematical, and engineering principles to model, test, and improve complex systems.
Working with complex systems involves a range of resources including people, data and information, tools and appropriate technologies. Students must be able to create, apply and validate system models (as physical, mathematical, or logical representation of systems) and demonstrate competence in simulation and data literacy to address uncertainty and complexity at scale. This may involve using models and data to justify assumptions, explore scenarios, predict the consequences of actions, solve difference equations, conduct sensitivity and stability analysis, and predict the probability of risk.
This aligns with several AHEP4 outcomes: “apply mathematics, statistics, and engineering principles to solve complex problems” (LO1); “apply computational and analytical techniques while recognising limitations” (LO3); and “select and critically evaluate technical literature and other data sources” (LO4).
4. Design for complexity and changeability
The ability to design adaptable, robust, and resilient systems across their lifecycle.
Changes (both planned and unplanned) are inherent in complex systems. Long-term success of a system therefore requires design for resilience to first hand/internal (by the system), second hand/external (to the system) or third hand (around the system) change. Design for complexity and changeability ensures systems can evolve and integrate new capabilities across their lifecycle.
AHEP4 requires engineers to be able to innovatively “design solutions that meet a combination of societal, user, business and customer needs” (LO5). This may involve designing systems that deliver required functions over time, including evolution, adaptability, and integration across subsystems (capability engineering), and supports evaluation of alternatives, balance competing objectives, and justify transparent decisions (decision management).
5. Project and lifecycle management
The ability to plan and deliver engineering activities across the system lifecycle, ensuring outcomes are delivered on time, on cost, and with integrity.
Complex systems involve many subsystems with various purposes and lifecycles. This necessitates effective coordination and delivery processes and a focus on early planning and lasting systemic impacts. Project and lifecycle management allows for concurrent engineering (parallelisation of tasks), and verification and validation of tasks in dynamic environments. Graduates must “apply knowledge of engineering management principles, commercial context, project and change management” (AHEP4, LO15).
This aligns with the Engineering Attribute of Project Management and Teamwork and the INCOSE Framework competencies in Lifecycle Processes, Integration, and Project Management, emphasising coordinated delivery and long-term value creation across socio-technical systems. Lifecycle awareness prevents short-term optimisation and emphasises aspects such as maintainability, whole-life value delivery and total expenditure (TOTEX) thinking, all of which support efforts towards sustainability and net-zero.
6. Risk and uncertainty management
The ability to identify, assess, and manage technical, social, environmental, and ethical risks at multiple levels of complex systems.
Complex systems are inherently uncertain, with cascading risks that must be anticipated and managed proactively. Risk management enables students to quantify source and impact of uncertainties where possible and apply precaution where uncertainty is irreducible, ensuring safety, sustainability, and governance.
AHEP4 requires graduates to “use a structured risk management process to identify, evaluate and mitigate risks (the effects of uncertainty)” (LO9), ranging from project-specific challenges to systemic threats, which need to “adopt a holistic and proportionate approach to the mitigation of security risks” (LO10).
7. Collaboration and communication
The ability to work effectively across disciplines, boundaries, and cultures, while conveying complex insights clearly to technical and non-technical audiences.
Complex systems challenges cannot be solved by individuals alone and include consideration for stakeholders across industry, policy and society. Such collaborative processes involve participatory problem-solving, learning from others, inclusive communication, and negotiation and persuasion strategies, all of which necessitate emotional intelligence.
AHEP4 expects graduates to “function effectively as an individual, and as a member or leader of a team, being able to evaluate own and team performance” (LO16). They must be able to influence stakeholder decisions, foster alignment, and shape outcomes across industry, policy, and society (AHEP4, LO17).
8. Professional responsibility
The ability to apply professional and societal responsibilities in decision-making, with awareness of ethical implications and long-term impacts and unintended consequences of engineered systems.
Engineers increasingly work on complex systems that shape lives, societies, and ecosystems. Ethical responsibility ensures that technical competence aligns with social good and involves consideration for trade-offs between factors including environmental impact, affordability and social acceptance. This aligns with AHEP4, IEA, and INCOSE principles on ethics, professionalism, and leadership, ensuring engineers act responsibly within complex systems and contribute positively to society and sustainability. AHEP4 requires graduates to “identify and analyse ethical concerns and make reasoned ethical choices informed by professional codes of conduct” (LO8) and “evaluate the environmental and societal impact of solutions to complex problems” (LO7).
Conclusions:
This article defines a set of eight integrated competencies that prepare engineering graduates to navigate complex systems. Together, they combine knowledge (what graduates must know), skills (what they can do), and attitudes (how they behave and think). Embedding these competencies requires project-based learning, interdisciplinary collaboration, and reflective exercises, while assessment should include portfolios, teamwork, and scenario analysis. Employers and professional bodies can reinforce these competencies through mentoring, internships, and early career development.
By aligning with INCOSE, AHEP4, and IEA GA frameworks (see Appendix for mapping), this guidance provides an internationally consistent foundation that can be adapted to local contexts, equipping engineering graduates to address complex, interdependent challenges of the 21st century with competence, integrity, and resilience.
Appendix:
Mapping between Eight Core Competencies and Standard frameworks
Proposed Core Competency
INCOSE *
AHEP4 **
IEA GA ***
Systems Thinking & Problem Framing
ST
LO2, LO6
WA2
Critical Thinking
CT
LO4
WA4, WA11
Simulation, Modelling & Data Literacy
IM, SM
LO1, LO3, LO4
WA1, WA4, WA5
Design for Complexity & Changeability
CP, DM, DF
LO5
WA3
Project & Lifecycle Management
LC, PL,CE, CP
LO15
WA10
Risk & Uncertainty Management
CE, PL, RO
LO9, LO10
–
Collaboration & Communication
CC, TD, TL, EI
LO16, LO17
WA8, WA9
Professional Responsibility
EI, EP
LO7, LO8
WA6, WA7
* INCOSE Competency Framework, 2nd edition (2018)
** AHEP4 Learning Outcome (LO) (2025)
*** International Engineering Alliance (IEA) Graduate Attributes (GA) (2021)
Any views, thoughts, and opinions expressed herein are solely that of the author(s) and do not necessarily reflect the views, opinions, policies, or position of the Engineering Professors’ Council or the Toolkit sponsors and supporters.
Downloads: A PDF of this resource will be available soon.
Who is this article for?: This article should be read by educators at all levels of higher education looking to highlight the connection between complex systems and sustainability within engineering learning.
Related INCOSE Competencies: Toolkit resources are designed to be applicable to any engineering discipline, but educators might find it useful to understand their alignment to competencies outlined by the International Council on Systems Engineering (INCOSE). The INCOSE Competency Framework provides a set of 37 competencies for Systems Engineering within a tailorable framework that provides guidance for practitioners and stakeholders to identify knowledge, skills, abilities and behaviours crucial to Systems Engineering effectiveness. A free spreadsheet version of the framework can be downloaded.
This resource relates to the Systems Thinking, Life Cycles, Capability Engineering, Systems Modelling and Analysis, and Design INCOSE competencies.
AHEP mapping: This resource addresses several of the themes from the UK’s Accreditation of Higher Education Programmes fourth edition (AHEP4): Analytical Tools and Techniques (critical to the ability to model and solve problems), and Integrated / Systems Approach(essential to the solution of broadly-defined problems). In addition, this resource addresses AHEP themes of Materials, equipment, technologies and processes, and Sustainability.
Several sustainability challenges, such as transitioning to a circular economy, are embedded in complex socio-technical systems. A circular economy is an economic model that replaces the linear take-make-dispose pattern with systems that keep materials and products in use for longer through designing for durability, reuse, remanufacturing, and recycling, while minimising waste and regenerating natural systems (Rizos, Tuokko, and Behrens, 2017).
Complex systems like these exhibit feedback loops, delays, non-linear change, path dependence and emergent behaviour (Sterman, 2000; Meadows, 2008). This article introduces the idea of systems-based interventions using the example of aluminium recycling systems. It is designed for engineering educators who plan to provide learners with a baseline understanding of complexity and practical entry points for designing and developing and evaluating interventions that can move a system towards sustainability.
Complexity of aluminium recycling systems:
Aluminium is infinitely recyclable, yet achieving truly closed material loops at scale remains a challenge. Most of today’s recycling occurs in situations where post-consumer scrap is collected from a wide variety of end-of-life products and the boundaries of the recycling system are difficult to define and control. This creates high variability in both the composition and the quality of recovered aluminium, since different products contain different alloys and levels of contamination (IRT M2P, 2023). At the same time, the volume of available scrap is difficult to predict, as it depends on product lifespans and consumer behaviour. These fluctuations make it harder for producers to plan and optimise secondary aluminium output, particularly when industries rely on consistent standards or just-in-time manufacturing.
The recycling system is also shaped by broader economic and regulatory forces. On the one hand, demand for low-carbon materials and the cost advantage of recycled over primary aluminium are powerful drivers of growth. On the other hand, the system faces constraints from volatile scrap prices and shifting global trade dynamics, such as U.S. tariffs on aluminium imports. Meanwhile, new policy instruments are adding further complexity. The EU’s Carbon Border Adjustment Mechanism (CBAM) is set to reshape trade flows and investment patterns, while the forthcoming Digital Product Passport (DPP) will transform how information is shared across the value chain. Together, these forces influence technologies, markets and business models, underscoring the dynamic and interconnected nature of aluminium recycling.
These interconnected factors highlight aluminium recycling as a complex socio-technical system, in which technological capabilities, market incentives, policy frameworks, and global trade are deeply interconnected. For educators, this makes aluminium an effective example for teaching students how multiple forces interact to create both opportunities and challenges for sustainable engineering.
Intervention from systems perspective:
System Dynamics (SD), first formalised byForrester (1968), has proven to be a highly valuable approach for understanding and managing complex resource and recovery systems. SD is an interdisciplinary approach, drawing on insights from psychology, organisational theory, economics, and related fields (Sterman, 2000). More supporting information about SD pedagogical tools and techniques can be found through the System Dynamics Society and Insight Maker.
From a systems perspective, interventions are not isolated events but strategic effort to influence system behaviour by targeting its structure and dynamics. A key concept here is leverage points – places within a complex system where small changes can lead to significant, systemic effects (Meadows, 1999). Meadows identified twelve types of leverage points, ranging from adjusting parameters to transforming the system’s underlying goals and paradigms, proving a conceptual framework for identifying impactful intervention.
Figure 1. Donella Meadows’ leverage points (Source: based on Meadows (1999); credit: UNDP/Carlotta Cataldi; reproduced fromBovarnick and Cooper (2021))
Exploration of potential leverage points:
System Dynamics (SD) tools such as Causal Loop Diagrams (CLDs) can help explore leverage points. CLDs can help visualise main components of a system and their interdependencies, making complex dynamics easier to understand. Besides, the process of building a CLD or more computational SD model encourages practitioners to clarify system boundaries, relationships, and drivers, laying the foundation for identifying leverage points.
For example, a CLD of aluminium recycling might capture how classification and sorting processes influence scrap quality, which then affects remelting efficiency and ultimately market uptake of recycled alloys (see Figure 2 below).
Figure 2. The causal loop diagram for auto aluminium recycling (Liu et al., 2025)
By tracing these circular cause-and-effect relationships, learners can see where interventions may ripple through the system. Highlighting reinforcing loops, balancing loops, and delays also shows why some interventions produce limited short-term results but more substantial long-term effects.
Leverage points can also be examined through the lens of information, rules, and goals. Improved information flows, such as those enabled by the Digital Product Passport, could reshape how scrap is sorted and valued. Rules, such as alloy specifications or trade tariffs, determine what types of recycled material can enter the market. At a deeper level, the goals of the system, whether to maximise throughput or to retain material value, fundamentally shape behaviour. Here too, CLDs are valuable because they allow users to visualise how changes to information, rules, or goals can shift system dynamics, providing a clearer picture of where interventions might be most effective.
Implication for educators:
This article equips educators with a focused, practical pathway to teach systems thinking through the example of aluminium recycling. Students can gain both conceptual understanding and hands-on skills to map feedback loops, identify delays, and design interventions that account for short-term trade-offs and long-term system behaviour. Teaching a single clear CLD followed by one modelling or scenario activity produces measurable learning gains while keeping the task accessible for beginners.
Educational approach:
Prioritise structure before solutions: have students map feedback loops and delays before proposing fixes.
Use one classroom-ready CLD as the anchor activity and one hands-on modelling task to test interventions.
Emphasise leverage thinking: move from parameter tweaks to information, rules, goals and paradigms as students mature.
Keep language simple and concrete: avoid jargon, introduce terms with examples, and reuse the same CLD across activities.
Use open-access tools (Insight Maker, Loopy, Vensim PLE) so students can visualise and experiment without software barriers.
Focus assessment on reasoning about system behaviour and predicted long-term effects rather than exact numerical answers.
Potential related learning outcomes within this topic:
Define stocks, flows, feedback loops, delays, reinforcing and balancing loops.
Explain why aluminium recycling is a complex socio-technical system influenced by technology, markets, policy, and information.
Construct a simple CLD for an aluminium recycling pathway and identify at least two reinforcing and one balancing loop.
Identify two leverage points and justify which one to prioritise, citing anticipated short- and long-term system effects.
Translate the CLD into a basic stock-and-flow sketch in an open-access tool and run one scenario to compare outcomes.
Further resources:
European Commission: Joint Research Centre, Environmental and socio-economic impacts of the circular economy transition in the EU cement and concrete sector – Analysing plastics material flows with life cycle-based and macroeconomic assessment models, Publications Office of the European Union, 2025, https://data.europa.eu/doi/10.2760/6579506
The Complexity and Interconnectedness of Circular Cities and the Circular Economy for Sustainability — analysis of research themes and networked interactions relevant for urban/material systems; useful for teaching complexity and cross-sector links. https://onlinelibrary.wiley.com/doi/pdf/10.1002/sd.2766
Bovarnick, A. and Cooper, S. (2021) “From what to how: rethinking food systems interventions,” Agriculture for Development. Edited by K. Hussein, 22 April, pp. 49–53.
Forrester, J.W. (1968) “Industrial Dynamics—After the First Decade,” Management Science, 14(7), pp. 398–415. Available at: https://doi.org/10.1287/mnsc.14.7.398.
Liu, M., Schneider, K., Litos, L., Salonitis, K., 2025. Enhancing Secondary Aluminium Supply: Optimising Urban Mining Through a Systems Thinking Approach, in: Edwards, L. (Ed.), Light Metals 2025. Springer Nature Switzerland, Cham, pp. 1273–1279.
Meadows, D.H. (1999) Leverage Points – Places to Intervene in a System, The Sustainability Institute.
Meadows, D.H. (2008) Thinking in systems: A primer. White River Junction, VT: Chelsea Green Publishing Company.
Sterman, J. (2000) “Business Dynamics, System Thinking and Modeling for a Complex World.” Available at: http://hdl.handle.net/1721.1/102741 (Accessed: September 4, 2025).
Any views, thoughts, and opinions expressed herein are solely that of the author(s) and do not necessarily reflect the views, opinions, policies, or position of the Engineering Professors’ Council or the Toolkit sponsors and supporters.
Who is this article for?: Thisarticle should be read by educators at all levels in higher education who are seeking an overall perspective on teaching approaches for integrating complex systems in engineering education.
Related INCOSE Competencies: Toolkit resources are designed to be applicable to any engineering discipline, but educators might find it useful to understand their alignment to competencies outlined by the International Council on Systems Engineering (INCOSE). The INCOSE Competency Framework provides a set of 37 competencies for Systems Engineering within a tailorable framework that provides guidance for practitioners and stakeholders to identify knowledge, skills, abilities and behaviours crucial to Systems Engineering effectiveness. A free spreadsheet version of the framework can be downloaded.
This resource relates to the Systems Thinking and Critical Thinking INCOSE competencies.
AHEP mapping: This resource addresses several of the themes from the UK’s Accreditation of Higher Education Programmes fourth edition (AHEP4): Analytical Tools and Techniques (critical to the ability to model and solve problems), and Integrated / Systems Approach (essential to the solution of broadly-defined problems).
Premise:
This document aims to provide definitions of key terms regarding engineered complex systems.
There are many existing relevant glossaries (for example, the Systems Engineering Body of Knowledge or SEBoK) so we have implemented a process to select a curated list of 14 common terms that are fundamental when considering the idea of complexity in engineered solutions, and therefore of importance to educators in this space. Rather than adding new definitions for each term we offer appropriate and accessible definitions from the literature, together with commentary exploring wider context and consideration where relevant.
Approach:
Some care is needed when using any definition around terms relating to complexity – because complexity itself is complex. There are multiple valid perspectives and so any one definition is unlikely to capture the totality of nuance and satisfy the variety of viewpoints. The process for selecting these terms involved collating an initial long list for potential inclusion, along with the ways in which each has been previously defined. These are provided as a supplementary annex to the main glossary. The method is further described in the following sub-section.
An initial list of potential terms to define was generated by cross-referencing existing glossaries. Terms that occurred in multiple glossaries were included in the long list. The definitions of these terms were extracted from these existing glossaries and are cited in the references. In addition, the relationship to the INCOSE Competencies is shown. The range of potential terms, and the variety of definitions that already exist, illustrate the complexity of describing complexity!
The authors used three categorisations of the definitions to help further group and classify the terms. The following categories are tagged to relevant terms in the glossary:
1. Property – whether or not the term describes a property applied to systems;
2. Principle – whether or not the term represents a principle that should be used when engineering complex situations or systems;
3. Approach – whether or not the term represents an approach, or element of an approach that should / could be used when engineering complex situations or systems.
Finally, explanatory commentary was added to most definitions to more specifically address an engineering education context.
Glossary:
Architecture
Definition: “an abstract description of the entities of a system and the relationship between those entities.” Crawley et al. (2016) System Architecture: Strategy & Product Development for Complex Systems
Boundary
#Property #Principle
Definition: “Define the system to be addressed. A description of the boundary of the system can include the following: definition of internal and external elements/items involved in realizing the system purpose as well as the system boundaries in terms of space, time, physical, and operational. Also, identification of what initiates the transitions of the system to operational status and what initiates its disposal is important.” NASA (2007) NASA Systems Engineering Handbook, p304
Commentary: The boundary defines the scope of the system being considered, and by implication, what sits outside of the system. As such, it is critically important to define the boundary of the system-of-interest. When dealing with complex systems this can be a challenging task and may even benefit from acknowledging multiple boundaries (e.g. physical, spatial, functional, logical etc.). For example, the boundary of the physical elements of a system could be considered within a wider boundary of the problem space.
Complexity
#Property
Definition: “A complex system is a system in which there are non-trivial relationships between cause and effect: each effect may be due to multiple causes; each cause may contribute to multiple effects; causes and effects may be related as feedback loops, both positive and negative; and cause-effect chains are cyclic and highly entangled rather than linear and separable.” INCOSE (2019) INCOSE Systems Engineering and Systems Definitions
Commentary: Early conceptions of complexity emphasised the difficulty in understanding, predicting or verifying the behaviours of a system. A key distinction arising from this is the complicated and complex are not synonymous. This concept of the difficulty in predicting behaviours is reflected in the definitions of the NASA Systems Engineering Handbook, SEBoK and ISO 24765. This is the key resultant consideration but does not describe the underlying property which causes this difficulty. While this definition relates more to complex systems than complexity, it is chosen for the way in which it goes beyond the consequences of complexity.
Coupling
#Property #Principle
Definition: “Coupling […] means to fasten together, or simply to connect things […] Coupling suggests a relationship between connected entities. If they are coupled, in some way they can affect each other […] For the system to be useful, its components have to be connected – coupled – so that they can work together. That said, putting them together arbitrarily won’t do the trick. The components have to be coupled in a way that achieves the goals of the system. Not only is coupling the glue that holds a system together, but it also makes the value of the system higher than the sum of its parts.” Khononov (2024) Balancing Coupling in Software Design: Universal Design Principles for Architecting Modular Software Systems, Ch1
Commentary: Coupling is a very important concept. It is the interconnection and interdependence that makes the system more (or less) than the sum of its parts. Standard Systems architecture advice is to minimise coupling between system elements (or between the systems in a system-of-systems). This is because high coupling correlates to higher structural complexity, reduced resilience and flexibility in the system, and introduces challenges for modularity in the system design. Lower or looser coupling means changes in one part of the system (in design or operation) are less likely to induce or require changes in another part. However, this lower coupling is not always possible and may be necessary to improve system performance (for example communication through intermediate layers in a system to reduce coupling can introduce unacceptable amounts of overhead and latency in the system). In design terms, high coupling between system elements means that those elements cannot be designed independently.
Emergence
#Principle
Definition: “As the entities of a system are brought together, their interaction will cause function, behaviour, performance and other intrinsic (anticipated and unanticipated) properties to emerge… Emergence refers to what appears, materializes, or surfaces when a system operates.” Crawley et al. (2016) System Architecture: Strategy & Product Development for Complex Systems
Commentary: It is worth noting that Crawley et al. (2014) go on to add “As a consequence of emergence, change propagates in unpredictable ways. System success occurs when anticipated emergence occurs, while system failure occurs when anticipated emergent properties fail to appear or when unanticipated undesirable emergent properties appear.” This emergence that gives rise to the difficulty in understanding, predicting or verifying the behaviours of a system (see Complexity).
Form
#Property
Definition: “The shape, size, dimensions, mass, weight, and other measurable parameters which uniquely characterize an item.” SAE International (2019) ANSI/EIA-649C
Function
#Principle #Approach
Definition: “A function is defined as the transformation of input flows, with defined performance targets for how well the function is performed in different conditions. A function usually has logical pre-conditions that trigger its operation. ”Systems Engineering Body of Knowledge v2.12 (2025)
Commentary: In general usage it is common to hear reference to ‘Form and Function’ in tandem, but it is the distinction between them and their relationship to one another that is important to engineering complex systems. Thinking in terms of functionality is a good way of abstracting the system to define what it does (or is needed to do) rather than what it is (and therefore by extension its form). Functions are normally allocated to single sub-elements of the system. Complexity arises at functional interfaces, or when different elements perform the same function. Thinking in terms of functionality encourages creativity as designers consider all the different ways in which the function could be performed – and then apply requirement constraints to choose the best/most feasible option. Thinking in terms of “objects” first constrains design by presupposing the solutions. Equally, when the solution goes wrong, thinking in terms of what function is failing and why, rather than focusing on a failed part allows identification of the true root cause. Organisations also have functions (such as Engineering, Human Resources, etc.) as a group of roles that perform a specific set of activities. This is important for considering the organisation/System that creates the engineered solution (which is itself a complex system, but secondary to the main application of the idea of function).
Iteration
#Approach
Definition: “Iteration is used as a generic term for successive application of a systems approach to the same problem situation, learning from each application, in order to progress towards greater stakeholder satisfaction.” Systems Engineering Body of Knowledge v2.12 (2025)
Lifecycle
#Property #Principle #Approach
Definition: “The evolution of a system, product, service, project or other human-made entity from conception through retirement.” ISO (2024) ISO/IEC/IEEE 24748-1:2024
Commentary: Understanding the lifecycle of an engineered artefact is very important. Issues arising in later stages (e.g. production, support/maintenance, upgrade and disposal) must be considered during the system’s initial development. In a system-of-systems or a capability system a significant source of complexity is the fact that different system elements have different lifecycles, and so may change or be changed independently of other elements with which they may interact or interdepend.
Model
#Approach
Definition: “An abstraction of a system, aimed at understanding, communicating, explaining, or designing aspects of interest of that system” Dori, D. (2003) Conceptual modelling and system architecting, p286
Commentary: An abstraction is a simplification. The selection of what to exclude, what to include, and at what level of granularity to depict it, is informed by the purpose of the model and the point of view from which it is created. Models do not have to be quantitative, nor is their purpose exclusively analytical.
Stakeholder
Definition: “A group or individual who is affected by or has an interest or stake in a program or project.” NASA (2019) NASA Systems Engineering Handbook SP-2016-6105 (Rev. 2)
Commentary: It is worth noting the potential difference between a stakeholder of the project that develops the system, and a stakeholder of the system that is developed.
System
#Principle #Approach
Definition: “A system is an arrangement of parts or elements that together exhibit behaviour or meaning that the individual constituents do not.” INCOSE (2019) INCOSE Fellows Briefing to INCOSE Board of Directors, January 2019
Commentary: There are many similar definitions of a system, each may offer a slightly different phrasing which can resonate better with different individuals. The origins of this definition is explained in the Systems Engineering Body of Knowledge. In assessing complexity in engineered system, the concept of “systems” is of course of key value. There are two important aspects two consider:
1) Many schools of Systems Science argue that systems do not actually exist (apart from perhaps the complete universe) – they are defined for the convenience of consideration, and so the definition of the boundary of the “system of interest” is both important and somewhat arbitrary. As such, the system-of-interest can have multiple useful boundaries. While it might be possible to identify and articulate the physical boundary of an engineered artefact (and it should be acknowledged), it might not be the most useful boundary to consider.
2) The point of defining a “system of interest” includes being able to consider it as a system and so use the properties seen in systems (boundary, interface with outside, affected by/affecting environment, made up of parts, part of something larger, has a lifecycle, seen differently by different people (with different perspectives), are dynamic, exhibit emergence etc.) as a “framework for curiosity” (as the INCOSE SE competency framework defines systems thinking).
In engineered systems (rather than natural systems) it is important to distinguish between purpose (what those engineering or creating it want it do) and emergence (what it actually does).
Systems Engineering
#Principle #Approach
Definition: “Systems Engineering is a transdisciplinary and integrative approach to enable the successful realization, use, and retirement of engineered systems, using systems principles and concepts, and scientific, technological, and management methods.” INCOSE (2019) INCOSE Systems Engineering and Systems Definitions
Systems Thinking
#Approach
Definition: “Systems thinking is thinking about a question, circumstance, or problem explicitly as a system – a set of interrelated entities.” Crawley et al. (2016) System Architecture: Strategy & Product Development for Complex Systems
Commentary: Crawley et al (2016) go on to add “This means identifying the system, its form and function, by identifying its entities and their interrelationships, its system boundary and context, and the emergent properties of the system based on the function of the entities, and their functional interactions.”
References:
Crawley, E. Cameron, B. & Selva, D. (2016). System Architecture: Strategy & Product Development for Complex Systems, Pearson
Dori, D. (2003). “Conceptual modeling and system architecting.” Communications of the ACM, 46(10), pp. 62-65.
ISO (2024). Systems and software engineering — Life cycle management -ISO/IEC/IEEE 24748-1:2024
Khononov, V. (2024). Balancing Coupling in Software Design: Universal Design Principles for Architecting Modular Software Systems, Addison-Wesley Professional,
NASA. (2007). Systems Engineering Handbook – Revision 1. Washington, DC, USA: National Aeronautics and Space Administration (NASA). NASA/SP-2007-6105.
NASA (2016). Systems Engineering Handbook – Revision 2. Washington, DC, USA, National Aeronautics and Space Administration (NASA). NASA/SP-2016-6105 (Rev. 2)
SAE International (2019). National Consensus Standard for Configuration Management -ANSI/EIA-649C
Any views, thoughts, and opinions expressed herein are solely that of the author(s) and do not necessarily reflect the views, opinions, policies, or position of the Engineering Professors’ Council or the Toolkit sponsors and supporters.
Downloads: A PDF of this resource will be available soon.
Who is this article for?: Thisarticle should be read by educators at all levels in higher education who are seekingto provide students with an overall perspective on complex systems in engineering.
Related INCOSE Competencies: Toolkit resources are designed to be applicable to any engineering discipline, but educators might find it useful to understand their alignment to competencies outlined by the International Council on Systems Engineering (INCOSE). The INCOSE Competency Framework provides a set of 37 competencies for Systems Engineering within a tailorable framework that provides guidance for practitioners and stakeholders to identify knowledge, skills, abilities and behaviours crucial to Systems Engineering effectiveness. A free spreadsheet version of the framework can be downloaded.
This resource relates to the Systems Thinking and Critical Thinking INCOSE competencies.
AHEP mapping: This resource addresses several of the themes from the UK’s Accreditation of Higher Education Programmes fourth edition (AHEP4): Analytical Tools and Techniques (critical to the ability to model and solve problems), and Integrated / Systems Approach (essential to the solution of broadly-defined problems).
Engineering systems today are increasingly complex, interconnected, and adaptive. To understand and manage them effectively, engineers must move beyond reductionist thinking where systems are broken into isolated parts and adopt systems thinking, which views systems as wholes made up of interacting components.
At the heart of this perspective lies emergence, a defining characteristic of complex systems. Emergence refers to properties or behaviours that arise from interactions among components but cannot be predicted or understood by examining those components in isolation. Appreciating emergence helps engineers anticipate how individual design decisions can produce system-level outcomes, sometimes beneficial, sometimes negative and unintended.
This article introduces the concept of emergence as one key characteristic of complex systems, situates it within systems thinking, and provides practical guidance for recognising and managing emergent behaviours in engineering practice.
1. What is a system?:
A system can be defined as “a set of interconnected elements organised to achieve a purpose” (Meadows, 2008). Systems possess structure (components), relationships (interactions), and purpose (function). Engineering systems such as aircraft, power grids, transport networks, or data infrastructures are composed of numerous subsystems that depend on each other.
Crucially, systems thinking emphasises interdependence and feedback. The behaviour of the whole cannot be fully explained by the behaviour of the parts alone. Properties such as resilience, adaptability, and emergence result from interactions within the system’s structure and environment. Recognising these relationships is essential to understanding how system-level behaviours arise.
Emergence describes the appearance of new patterns, properties, or behaviours at the system level that are not present in individual components. These properties are often irreducible: they cannot be explained solely by analysing each part separately (Holland, 2014).
Researchers distinguish between:
Weak emergence – behaviours that are theoretically predictable if all component interactions were known but are practically impossible to compute due to complexity (e.g. traffic flow patterns).
Strong emergence – properties that are fundamentally novel and irreducible to component-level descriptions (e.g., consciousness in biological systems).
In engineering, most emergent behaviours are weakly emergent: complex yet explainable with sufficient data and computational tools such as agent-based modelling or system dynamics.
A key caveat is that emergence depends on perspective and system boundaries. What seems emergent at one scale (e.g., the stability of a power grid) might appear straightforward when viewed at another. Therefore, engineers must define boundaries and assumptions clearly when analysing emergence.
3. Why emergence matters in engineering:
Emergence shapes how engineering systems behave, evolve, and sometimes fail. It can produce both desired outcomes (like adaptability or resilience) and undesired ones (like instability or cascading failure).
Understanding emergence enables engineers to:
anticipate how local interactions scale up to global system behaviour;
design feedback loops and architectures that promote stability; and
identify potential points for intervention when emergent behaviour becomes undesirable.
For instance, in cyber-physical systems, emergent coordination can enhance efficiency, but it may also create unpredictable vulnerabilities if feedback loops reinforce errors. Engineers therefore must not only observe emergence but learn how to influence it through design and governance.
4. Recognising and managing emergent behaviour:
Recognising emergence
Engineers can identify emergence by looking for:
System-level patterns that do not trace directly to any single component (e.g. global traffic flow or collective oscillations in a power grid).
Unexpected behaviours, such as new failure modes or self-organising phenomena.
Scale-dependent properties, where behaviour changes qualitatively as the system grows or interacts with its environment.
Adaptive or learning responses, where the system adjusts without explicit central control.
Intervening in emergent systems
Not all emergence is beneficial. Engineers often need to mitigate unwanted emergent behaviours such as instability or inefficiency while reinforcing desirable ones. Effective approaches include:
Redesigning interactions rather than individual components, focusing on how feedback and connectivity shape outcomes.
Introducing constraints or buffers to dampen runaway feedback loops.
Enhancing diversity and modularity so subsystems can adapt locally without propagating failures globally.
Monitoring system states continuously, using sensors, data analytics, or digital twins to detect emergent behaviour early.
Managing emergence requires humility: complex systems cannot be fully controlled, only influenced. The goal is to guide system dynamics toward safe and productive outcomes.
5. Illustrative examples of emergence in engineering systems:
Network systems
The Internet exemplifies emergence: billions of devices follow simple communication protocols, yet collectively create a resilient, adaptive global network. No single node dictates its performance; instead, routing efficiency and viral content propagation arise from local interactions among routers and users.
Transportation systems
Urban traffic patterns such as congestion waves, spontaneous lane formation, and adaptive rerouting emerge from individual driver behaviour and infrastructural design. Traffic engineers use simulation models to study how simple decision rules generate complex city-wide flows.
Energy systems
Electrical grids maintain frequency and voltage stability through distributed interactions among generators, loads, and controllers. Emergent synchronisation enables reliability, but loss of coordination can cause cascading blackouts showing both beneficial and harmful emergence.
Manufacturing systems
In smart factories, machines and sensors collaborate autonomously, producing system-wide optimisation in scheduling and quality control. Adaptive algorithms and feedback loops create emergent flexibility beyond what central planning alone could achieve.
6. Practical guidance for engineers and educators:
For engineers, the key is to design with emergence in mind:
focus on local rules that encourage desirable global behaviour;
incorporate feedback and sensing to detect changes early; and
use modular, diverse architectures to enhance resilience.
For educators, teaching emergence provides an opportunity to bridge theory and practice. Software such as NetLogo and Insight Maker allows students to visualise emergent behaviour through agent-based and system-dynamics models. Linking engineering examples to ecological, social, or digital systems helps learners appreciate the universality of emergence.
Conclusion:
Emergence is not an anomaly to be avoided but a natural attribute of complex systems. It challenges traditional engineering by revealing that system behaviour often arises from relationships, not components.
Understanding emergence equips engineers to recognise interdependencies, design adaptive solutions, and work with complexity rather than against it. By embracing systems thinking, engineers can create technologies that are not only functional but resilient, sustainable, and aligned with real-world dynamics.
References:
Holland, J.H. (2014). Complexity: A Very Short Introduction. Oxford: Oxford University Press.
Johnson, S. (2001). Emergence: The Connected Lives of Ants, Brains, Cities, and Software. New York: Scribner.
Mitchell, M. (2009). Complexity: A Guided Tour. Oxford: Oxford University Press.
Bar-Yam, Y. (2003). Dynamics of Complex Systems. Cambridge, MA: Perseus Publishing.
Helbing, D. (2013). Globally networked risks and how to respond. Nature, 497(7447), 51-59.
Any views, thoughts, and opinions expressed herein are solely that of the author(s) and do not necessarily reflect the views, opinions, policies, or position of the Engineering Professors’ Council or the Toolkit sponsors and supporters.
Licensing:This work is licensed under a Creative Commons Attribution-ShareAlike 4.0 International License. It is based upon the author’s 2025 article “A Simulation Tool for Pinch Analysis and Heat Exchanger/Heat Pump Integration in Industrial Processes: Development and Application in Challenge-based Learning”. Education for Chemical Engineers 52, 141–150.
Related INCOSE Competencies: Toolkit resources are designed to be applicable to any engineering discipline, but educators might find it useful to understand their alignment to competencies outlined by the International Council on Systems Engineering (INCOSE). The INCOSE Competency Framework provides a set of 37 competencies for Systems Engineering within a tailorable framework that provides guidance for practitioners and stakeholders to identify knowledge, skills, abilities and behaviours crucial to Systems Engineering effectiveness. A free spreadsheet version of the framework can be downloaded.
This resource relates to the Systems Thinking, Systems Modelling and Analysis and Critical Thinking INCOSE competencies.
AHEP mapping: This resource addresses several of the themes from the UK’s Accreditation of Higher Education Programmes fourth edition (AHEP4): Analytical Tools and Techniques (critical to the ability to model and solve problems), and Integrated / Systems Approach (essential to the solution of broadly-defined problems). In addition, this resource addresses the themes of Science, mathematics and engineering principles; Problem analysis; and Design.
Educational level: Intermediate.
Educational aim:To equip learners with the ability to model, analyse, and optimise pathways for industrial decarbonisation through a complex-systems lens – integrating technical, economic, and policy dimensions – while linking factory-level design decisions to wider value-chain dynamics, multi-stakeholder trade-offs, and long-term sustainability impacts.
Learning and teaching notes:
This teaching activity explores heat integration for the decarbonisation of industrial processes through the lens of complex systems thinking, combining simulation, systems-level modelling, and reflective scenario analysis. It is especially useful in modules related to energy systems, process systems, or sustainability.
Learners analyse a manufacturing site’s energy system using a custom-built simulation tool to explore the energy, cost and carbon-emission trade-offs of different heat-integration strategies. They also reflect on system feedback, stakeholder interests and real-world resilience using causal loop diagrams and role-played decision frameworks.
This activity frames industrial heat integration as a complex adaptive system, with interdependent subsystems such as process material streams, utilities, technology investments and deployments, capital costs, emissions, and operating constraints.
Learners run the simulation tool to generate outputs to explore different systems integration strategies: pinch-based heat recovery by heat exchangers, with and without heat pump-based waste heat upgrade. Screenshots of the tool graphical user interface are attached as separate files:
The learning is delivered in part, through active engagement with the simulation tool. Learners interpret the composite and grand composite curves and process tables, to explore how system-level outcomes change across various scenarios. Learners explore, using their generated simulation outputs, how subsystems (e.g. hot and cold process streams, utilities) interact nonlinearly and with feedback effects (e.g., heat recovery impacts), shaping global system behaviour and revealing leverage points and emergent effects in economics, emissions and feasibility.
Using these outputs as a baseline, and exploring other systems modelling options, learners evaluate trade-offs between heat recovery, capital expenditure (CAPEX), operating costs (OPEX), and carbon emissions, helping them develop systems-level thinking under constraints.
The activity embeds scenario analysis, including causal loop diagrams, what-if disruption modelling, and stakeholder role-play, using multi-criteria decision analysis (MCDA) to develop strategic analysis and systems mapping skills. Interdisciplinary reasoning is encouraged across thermodynamics, economics, optimisation, engineering ethics, and climate policy, culminating in reflective thinking on system boundary definitions, trade-offs, sustainability transitions and resilience in industrial systems.
Learners have the opportunity to:
Analyse non-linear interactions in thermodynamic systems.
Reconcile conflicting demands (e.g. energy savings vs costs vs emissions vs technical feasibility) using data generated from real system simulation.
Model and interpret feedback-driven process systems using pinch analysis, heat recovery via heat exchangers, and heat upgrade via heat pump integration.
Explore emergent behaviour, trade-offs, and interdisciplinary constraints.
Navigate system uncertainties by simulation data analysis and scenario thinking.
Understand the principles of heat integration using pinch analysis, heat exchanger networks, and heat pump systems, framed within complex industrial systems with interdependent subsystems.
Evaluate decarbonisation strategies and their performances in terms of energy savings, CAPEX/OPEX, carbon reduction, and operational risks, highlighting system-level trade-offs and nonlinear effects
Develop data-driven decision-making, navigating assumptions, parameter sensitivity, and model limitations, reflecting uncertainty and systems adaptation.
Explore ethical, sustainability, and resilience dimensions of engineering design, recognising how small changes or policy shifts may act on leverage points and produce emergent behaviours.
Analyse stakeholder dynamics, policy impacts, and uncertainty as part of the broader system environment influencing energy transition pathways.
Construct and interpret causal loop diagrams (CLDs), explore what-if scenarios, and apply multi-criteria decision analysis (MCDA), building competencies in feedback loops, system boundaries, and systems mapping.
Teachers have the opportunity to:
Embed systems thinking and complex systems pedagogy into energy and process engineering, using real-world simulations and data-rich problem-solving.
Introduce modelling and scenario-based reasoning, helping students understand how interactions between process units, energy streams, and external factors affect industrial decarbonisation.
Facilitate exploration of design trade-offs, encouraging learners to consider technical feasibility, economic sustainability, and environmental constraints within dynamic system contexts.
Support students in identifying leverage points, feedback loops, and emergent behaviours, using tools like CLDs, composite curves, and stakeholder role play.
Assess complex problem-solving capacity, including students’ ability to model, critique and adapt industrial systems under conflicting constraints and uncertain futures.
Proprietary Simulator for Pinch Analysis & Heat Integration. Freely available for educational use and can be accessed online through a secure link provided by the author on request (james.atuonwu@nmite.ac.uk or james.atuonwu@gmail.com). No installation or special setup is required; users can access it directly in a web browser.
About the simulation tool (access and alternatives):
This activity uses a Streamlit-based simulation tool, supported with process data (Appendix A, Table 1, or an educator’s equivalent). The tool is freely available for educational use and can be accessed online through a secure link provided by the author on request (james.atuonwu@nmite.ac.uk or james.atuonwu@gmail.com). No installation or special setup is required; users can access it directly in a web browser.The activity can also be replicated using open-source or online pinch analysis tools such as OpenPinch, PyPinchPinCH, TLK-Energy Pinch Analysis Online. SankeyMATIC can be used for visualising energy balances and Sankey diagrams.
Pinch Analysis, a systematic method for identifying heat recovery opportunities by analysing process energy flows, forms the backbone of the simulation. A brief explainer and further reading are provided in the resources section. Learners are assumed to have prior or guided exposure to its core principles. A key tunable parameter in Pinch Analysis, ΔTmin, represents the minimum temperature difference allowed between hot and cold process streams. It determines the required heat exchanger area, associated capital cost, controllability, and overall system performance. The teaching activity helps students explore these relationships dynamically through guided variation of ΔTmin in simulation, reflection, and trade-off analysis, as outlined below.
Introducing and prioritising ΔTmin trade-offs:
ΔTmin is introduced early in the activity as a critical decision variable that balances heat recovery potential against capital cost, controllability, and safety. Students are guided to vary ΔTmin within the simulation tool to observe how small parameter shifts affect utility demands, exchanger area, and overall system efficiency. This provides immediate visual feedback through the composite and grand composite curves, helping them connect technical choices to system performance.
Educators facilitate short debriefs using the discussion prompts in Part 1 and simulation-based sensitivity analysis in Part 2. Students compare low and high ΔTmin scenarios, reasoning about implications for process economics, operability, and energy resilience.
This experiential sequence allows learners to prioritise competing factors (technical, economic, and operational), while recognising that small changes can create non-linear, system-wide effects. It reinforces complex systems principles such as feedback loops and leverage points that govern industrial energy behaviour.
Data for decisions:
The simulator’s sidebar includes some default values for energy prices (e.g. gas and electricity tariffs) and emission factors (e.g. grid carbon intensity), which users can edit to reflect their own local or regional conditions. For those replicating the activity with other software tools, equivalent calculations of total energy costs, carbon emissions and all savings due to heat recovery investments can be performed manually using locally relevant tariffs and emission factors.
The Part 1–3 tasks, prompts, and assessment suggestions below remain fully valid regardless of the chosen platform, ensuring flexibility and accessibility across different teaching contexts.
Educator support and implementation notes:
The activity is designed to be delivered across 3 sessions (6–7.5 hours total), with flexibility to adapt based on depth of exploration, simulation familiarity, or group size. Each part can be run as a standalone module or integrated sequentially in a capstone-style format.
Part 1: System mapping: (Time: 2 to 2.5 hours) – Ideal for a classroom session with blended instruction and group collaboration:
This stage introduces students to the foundational step of any heat integration analysis: system mapping. The aim is to identify and represent energy-carrying streams in a process plant, laying the groundwork for further system analysis. Educators may use the Process Flow Diagram of Fig. 1, Appendix A (from a real industrial setting: a food processing plant) or another Process Diagram, real or fictional. Students shall extract and identify thermal energy streams (hot/cold) within the system boundary and map energy balances before engaging with software to produce required simulation outputs.
Key activities and concepts include:
Defining system boundaries: Focus solely on thermal energy streams, ignoring non-thermal operations. The boundary is drawn from heat sources (hot streams) to heat sinks (cold streams).
Identifying hot and cold streams: Students classify process material streams based on whether they release or require heat. Each stream is defined by its inlet and target temperatures and its heat capacity flow rate (CP).
Building the stream table: Students compile a simple table of hot/cold streams (name, supply temperature, target temperature and heat capacity flow CP).
Constructing energy balances and Sankey Diagrams: Students manually calculate energy balances across each subsystem in the defined system boundary, identifying energy inputs, useful heat recovery, and losses. Using this information, they construct Sankey diagrams to visualise the magnitude and direction of energy flows, strengthening their grasp of system-wide energy performance before optimisation.
Pinch Concept introduction: Students are introduced to the concept of “the Pinch”, including the minimum heat exchanger temperature difference (ΔTmin) and how it affects heat recovery targets (QREC), as well as overall heating and cooling utility demands (QHU & QCU, respectively).
Assumptions: All analysis is conducted under steady-state conditions with constant CP and no heat losses.
Discussion prompts:
What insights does the Sankey diagram reveal about energy use, waste and recovery potential in the system? How might these visual insights shape optimisation decisions?
Why might certain streams be excluded from the analysis?
How does the choice of ΔTmin influence the heat recovery potential and cost?
What trade-offs are involved in system simplification during mapping?
How can assumptions (like steady-state vs. transient) impact integration outcomes?
Student deliverables:
A labelled system map showing the thermal process boundaries, hot and cold streams.
A structured stream data table.
Justification for selected ΔTmin values based on process safety, economics, or practical design and operational considerations.
A basic Sankey diagram representing the energy flows in the mapped system, based on calculated heat duties of each stream.
Part 2: Running and interpreting process system simulation results (Time: 2 to 2.5 hours) – Suitable for lab or flipped delivery;only standard computer access is needed to run the tool (optional instructor demo can extend depth):
Students use the simulation tool to generate their own results.The process scenario of Fig. 1, Appendix A, with the associated stream data (Table 1) can be used as a baseline.
Tool-generated outputs:
Curves: Composite and Grand Composite (pinch location, recovery potential).
Scenario summary: QREC, QHU, QCU; COP (where applicable); CAPEX/OPEX/CO₂; payback period for various values of system levers (e.g., ΔTmin levels, tariffs, emission factors).
Heat Pump (HP) tables: Feasible pairs, Top-N heat pump selections (where N = 0, 1, or 2); QEVAP, QCOND, QCOMP, COP. All notations are designated in the simulator’s help/README section.
Learning tasks:
1. Scenario sweeps Run different scenarios (e.g., different ΔTmin levels, tariffs, emission factors, and Top-N HP selections). Prompts: How do QREC, QHU/QCU, HX area, and CAPEX/OPEX/CO₂ shift across scenarios? Which lever moves the needle most?
2. Group contrast (cases A vs B: see time-phased operations A & B in Appendix A) Assign groups different cases; each reports system behaviours and trade-offs. Prompts: Where do you see CAPEX vs. energy-recovery tension? Which case is more HP-friendly and why?
3. Curve reading Use the Composite & Grand Composite Curves to identify pinch points and bottlenecks; link features on the curves to the tabulated results. Prompts: Where is the pinch? How does ΔTmin change the heat-recovery target and utility demands?
4. Downstream implications Trace how curve-level insights show up in HX sizing/costs and HP options. Prompts: When does adding HP reduce utilities vs. just shifting costs? Where do stream temperatures/CP constrain integration?
5. Systems lens: feedback and leverage Map short causal chains from the results (e.g., tariffs → HP use → electricity cost → OPEX; grid-carbon → HP emissions → net CO₂). Prompts: Which levers (ΔTmin, tariffs, EFs, Top-N) create reinforcing or balancing effects?
Outcome:
Students will be able to generate and interpret industrial simulation outputs, linking technical findings to economic and emissions consequences through a systems-thinking lens. They begin by tracing simple cause–effect chains from the simulation data and progressively translate these into causal loop diagrams (CLDs) that visualise reinforcing and balancing feedback. Through this, learners develop the ability to explain how system structure drives performance both within the plant and across its broader industrial and policy environment.
Optional extension: Educators may provide 2–3 predefined subsystem options (e.g., low-CAPEX HX network, high-COP HP integration, hybrid retrofit) for comparison. Students can use a decision matrix to justify their chosen configuration against CAPEX, OPEX, emissions, and controllability trade-offs.
Part 3: Systems thinking through scenario analysis (Time: 2 to 2.5 hours) – Benefits from larger-group facilitation, a whiteboard or Miro board (optional), and open discussion. It is rich in systems pedagogy:
Having completed simulation-based pinch analysis and heat recovery planning, learners now shift focus to strategic implementation challenges faced in real-world industrial settings. In this part, students apply systems thinking to explore the broader implications of their heat integration simulation output scenarios, moving beyond process optimisation to consider real-world dynamics, trade-offs, and stakeholder interactions. The goal is to encourage students to interrogate the interconnectedness of decisions, feedback loops, and unintended consequences in process energy systems including but not limited to operational complexity, resilience to disruptions, and alignment with long-term sustainability goals.
Activity: Stakeholder role play / Multi-Criteria Decision Analysis Students take on stakeholder roles and debate which design variant or operating strategy should be prioritised. They then conduct a Multi-Criteria Decision Analysis (MCDA), evaluating each option based on criteria such as CAPEX, OPEX savings, emissions reductions, risk, and operational ease.
Stakeholders include:
Operations managers, focused on ease of control and process stability.
Investors and finance teams, focused on return on investment.
Environmental officers, concerned with emissions and policy compliance.
Engineers, responsible for design and retrofitting.
Community members, advocating for sustainable industry practices.
Government reps responsible for regulations and policy formulation, e.g. taxes and subsides.
The team must present a strategic analysis showing how the heat recovery system behaves as a complex adaptive system, and how its implementation can be optimised to balance technical, financial, environmental, and human considerations.
Optional STOP for questions and activities:
Before constructing causal loop diagrams (CLDs), learners revisit key results from their simulation — such as ΔTmin, tariffs, emission factors, and system costs — and trace how these parameters interact to influence overall system performance. Educators guide this transition, helping students abstract quantitative outputs (e.g., changes in QREC, OPEX, or CO₂) into qualitative feedback relationships that reveal cause-and-effect chains. This scaffolding helps bridge the gap between process simulation and systems-thinking representation, supporting discovery of reinforcing and balancing feedback structures.
Activity: Construct a causal loop diagram (CLD) Students identify at least five variables that interact dynamically in the implementation of a heat integration system (e.g. energy cost, investment risk, emissions savings, system complexity, staff training). They must map reinforcing and balancing feedback loops that illustrate trade-offs or virtuous cycles.
Where could policy or process changes trigger leverage points?
How could delays in response (e.g. slow staff adaptation to new technologies) affect outcomes?
How might design choices affect local energy equity, air quality, or community outcomes?
What policy incentives or ethical trade-offs might reinforce or hinder your proposed solution?
Instructor debrief (engineering context with simulation linkage): After students share their CLDs, the educator facilitates a short discussion linking their identified reinforcing and balancing loops to common dynamic patterns observable in the simulation results. For instance:
Limits to growth: As ΔTmin decreases, heat recovery (QREC) initially improves, but exchanger area, CAPEX, and controllability demands grow disproportionately — diminishing overall economic benefit.
Shifting the burden: Installing a heat pump may appear to improve carbon performance, but if low process efficiency remains unaddressed, electricity use and OPEX rise — creating a new dependency that shifts rather than solves the problem.
Tragedy of the commons: Competing units or stakeholders optimising locally (e.g. for their own OPEX or production uptime) can undermine total system efficiency or resilience.
Success to the successful: Design options with early financial or policy support (e.g. high-COP heat pumps) attract more investment and attention, reinforcing a positive but unequal feedback loop.
This reflection connects quantitative model outputs (e.g. QREC, OPEX, CAPEX, emissions) to qualitative system behaviours, helping learners recognise leverage points and understand how design choices interact across technical, economic, and social dimensions of decarbonisation.
Activity: Explore “What if?” scenarios
Working in groups, students choose one scenario to explore using a systems lens:
What if gas prices fluctuate drastically?
What if capital funding is delayed by 6 months?
What if a heat exchanger fouls during peak season?
What if CO₂ emissions policy tightens?
What if current electricity grid decarbonisation trends suffer an unexpected setback?
What if government policies now encourage onsite renewable electricity generation?
Each group evaluates the resilience and flexibility of the proposed integration design. They consider:
System bottlenecks and fragilities.
Leverage points for intervention.
Need for redundancy or modular design.
Educators may add advanced scenarios (e.g. carbon tax introduction, supplier failure, or project delay) to challenge students’ resilience modelling and stakeholder negotiation skills.
Stakeholder impact reflection:
To extend systems reasoning beyond the technical domain, students assess how their chosen design scenarios (e.g., low vs. high ΔTmin, with or without heat pump integration) affect each stakeholder group. For instance:
Operations managers assess control complexity, downtime risk, and maintenance implications.
Finance teams evaluate CAPEX/OPEX trade-offs and payback periods.
Environmental officers examine lifecycle emissions and regulatory compliance.
Engineers reflect on reliability, retrofit feasibility, and process safety.
Community members or regulators consider social and policy outcomes, such as visible sustainability impact or energy equity.
Each team member rates perceived benefits, risks, or compromises under each design case, and the results are summarised in a stakeholder impact matrix or discussion table. This exercise links quantitative system metrics (energy recovery, emissions, cost) to qualitative stakeholder outcomes, reinforcing the “multi-layered feedback” perspective central to complex systems analysis.
Learning Outcomes (Part 3):
By the end of this part, students will be able to:
Identify systemic interdependencies in industrial energy systems.
Analyse how feedback loops and delays influence system behaviour.
Assess the resilience of energy integration solutions under different future scenarios.
Balance multiple stakeholder objectives in complex engineering contexts.
Apply systems thinking tools to communicate complex technical scenarios to diverse stakeholder audiences.
Use systems diagrams and decision tools to support strategic analysis.
Instructor Note – Guiding CLD and archetype exploration:
Moving from numerical heat-exchange and cost data to CLD archetypes can be conceptually challenging. Instructors are encouraged to model this process by identifying at least one reinforcing loop (e.g. “energy savings → lower OPEX → more investment in recovery → further savings”) and one balancing loop (e.g. “higher capital cost → reduced investment → lower heat recovery”). Relating these loops to common system archetypes such as “Limits to Growth” or “Balancing with Delay” helps students connect engineering data to broader system dynamics and locate potential leverage points. The activity concludes with students synthesising their findings from simulation, systems mapping, and stakeholder analysis into a coherent reflection on complex system behaviour and sustainable design trade-offs.
Assessment guidance:
This assessment builds directly on the simulation and systems-thinking activities completed by students. Learners generate and interpret their own simulation outputs (or equivalent open-source pinch analysis results), using these to justify engineering and strategic decisions under uncertainty.
Assessment focuses on students’ ability to integrate quantitative analysis (energy, cost, carbon) with qualitative reasoning (feedbacks, trade-offs, stakeholder dynamics), demonstrating holistic systems understanding.
Deliverables (portfolio; individual or group):
1. Reading and interpretation of simulation outputs
Use the outputs you generate (composite & grand composite curves: HX match/area/cost tables; HP pairing/ranking; summary sheets of QHU, QCU, QREC, COP, CAPEX, OPEX, CO₂, paybacks) for a different industrial process (from the one used in the main learning activity) to:
Identify the pinch point(s) and explain what the curves imply for recovery potential and bottlenecks.
Comment on QHU/QCU/QREC and how they change across the scenarios you run (e.g., ΔTmin, tariffs, emission factors, Top-N HP selection).
Interpret trade-offs among energy, CAPEX, OPEX, emissions, using numbers reported by the simulator. No calculations beyond light arithmetic/annotation.
2. Systems mapping and scenario reasoning
A concise system boundary sketch and a simple stream table.
A Causal Loop Diagram (CLD) highlighting key feedbacks (e.g., tariffs ↔ HP use ↔ grid carbon intensity ↔ emissions/cost).
A short MCDA (transparent criteria/weights) comparing the scenario variants you test; include a brief stakeholder reflection.
3. Decision memo (max 2 pages)
Your recommended integration option under stated assumptions, with one “what-if” sensitivity (e.g., +20% electricity price, tighter CO₂ factor).
State uncertainties/assumptions and any implementation risks (operations, fouling, timing of capital).
Students should include a short reflective note addressing assumptions, feedback insights, and how their stakeholder perspective shaped their recommendation.
Appendix A: Example process scenario for teaching activity:
Sample narrative: Large-scale food processing plant with time-sliced operations
The following process scenario explains the industrial context behind the main teaching activity simulations. A large-scale food processing plant operates a milk product manufacturing line. The process, part of which is shown in Fig. 1, involves the following:
Thermal evaporation of milk feed.
Cooking operations after other ingredient mixing and formulation upstream.
Oven heating to drive off moisture and stimulate critical product attributes.
Pre-finishing operations as the product approaches packaging.
In real operations, the evaporation subprocessoccurs at different times from the cooking/separation, oven and pre-finishing operations. This means that their hot and cold process streams are not simultaneously available for direct heat exchange. For a realistic industrial pinch analysis, the process is thus split into two time slices:
Time Slice A (used for scenario Case A): Evaporation streams only.
Time Slice B (Case B): Cooking/separation, oven and pre-finishing streams only.
Separate pinch analyses are performed for each slice, using the yellow-highlighted sections of Table 1 as stream data for time slice A, and the green-highlighted sections as stream data for time slice B. Any heat recovery between slices would require thermal storage (e.g., a hot-water tank) to bridge the time gap.
Fig.1. Simplified process flowsheet of food manufacturing facility.
Note on storage and system boundaries:
Because the two sub-processes occur at different times, direct process-to-process heat exchange between their streams is not possible without thermal storage. If storage is introduced:
Production surplus heat at time slice A can be stored at high temperature (e.g., 80 °C) and later discharged to preheat time slice B cold streams.
The size of the tank depends on the portion of hot utility demand of sub-process B to be offset, the temperature swing, and the duration of the sub-process B.
Table 1. Process stream data corresponding to flowsheet of Fig. 1. Yellow-highlighted sections represent processes available at time slice A, while green-highlighted sections are processes available at time slice B.
Appendix B: Suggested marking rubric (Editable):
Adopter note: The rubric below is a suggested template. Instructors may adjust criteria language, weightings and band thresholds to align with local policies and learning outcomes. No marks depend on running software.
1) Interpretation of Simulation Outputs — 25%
A (Excellent): Reads curves/tables correctly; uses QHU/QCU/QREC, COP, CAPEX/OPEX/CO₂, payback figures accurately; draws clear, defensible trade-offs.
B (Good): Mostly accurate; links numbers to decisions with some insight.
C (Adequate): Mixed accuracy; limited or generic trade-off discussion.
D/F (Weak): Frequent misreads; cherry-picks or contradicts generated data.
2) Systems Thinking & Scenario Analysis — 30%
A: Clear CLD with at least one reinforcing and one balancing loop; leverage points identified; scenarios coherent; MCDA with explicit criteria, weights, and justified ranking; uncertainty acknowledged.
B: Reasonable CLD; scenarios sound; MCDA present with partial justification.
C: Superficial CLD; scenarios/MCDA incomplete or weakly reasoned.
D/F: Little or no systems view; scenarios/MCDA absent or not meaningful.
Atuonwu, J.C. (2025). A Simulation Tool for Pinch Analysis and Heat Exchanger/Heat Pump Integration in Industrial Processes: Development and Application in Challenge-based Learning. Education for Chemical Engineers 52, 141-150.
Oh, X.B., Rozali, N.E.M., Liew, P.Y., Klemes, J.J. (2021). Design of integrated energy- water systems using Pinch Analysis: a nexus study of energy-water-carbon emissions. Journal of Cleaner Production 322, 129092.
Rosenow, J., Arpagaus, C., Lechtenböhmer, S.,Oxenaar, S., Pusceddu, E. (2025). The heat is on: Policy solutions for industrial electrification. Energy Research & Social Science 127, 104227.
Bale, C.S.E., Varga, L., Foxon, T.J. (2015). Energy and complexity: New ways forward. Applied Energy 138, 150-159.
Atuonwu, J.C. (2025). Proprietary Simulator for Pinch Analysis & Heat Integration. Private reviewer access available on request (demo video or temporary login).
Any views, thoughts, and opinions expressed herein are solely that of the author(s) and do not necessarily reflect the views, opinions, policies, or position of the Engineering Professors’ Council or the Toolkit sponsors and supporters.
Keywords: Climate change; Policy; Carbon emissions; Built environment; Energy production; Renewable energy; Sustainability; Simulation.
Licensing:This work is licensed under a Creative Commons Attribution-ShareAlike 4.0 International License. It was originally developed as part of the Strathclyde Climate Ambassadors Networks (StrathCAN) at Strathclyde in collaboration with the Centre for Sustainable Development.
Related INCOSE Competencies: Toolkit resources are designed to be applicable to any engineering discipline, but educators might find it useful to understand their alignment to competencies outlined by the International Council on Systems Engineering (INCOSE). The INCOSE Competency Framework provides a set of 37 competencies for Systems Engineering within a tailorable framework that provides guidance for practitioners and stakeholders to identify knowledge, skills, abilities and behaviours crucial to Systems Engineering effectiveness. A free spreadsheet version of the framework can be downloaded.
This resource relates to the Systems Thinking, and Critical Thinking INCOSE Competencies.
AHEP mapping: This resource addresses several of the themes from the UK’s Accreditation of Higher Education Programmes fourth edition (AHEP4):Integrated / Systems Approach (essential to the solution of broadly-defined problems), Problem analysis, Sustainability, and Science, mathematics, and engineering principles.
Educational level: Beginner.
Learning and teaching notes:
The two complementary workshops, Climate Fresk and En-ROADS, are introduced to situate Renewable Energy Technologies within the wider context of the Net Zero transition. Their purpose is first to deepen students’ understanding of the climate science that underpins climate change as the driver of technical innovation, and then to broaden awareness of the social, economic, political, and environmental factors that shape global decarbonisation pathways. Building on this foundation, the workshops shift focus to the policy levers required to enable systems change – highlighting, often with surprising insights, their relative effectiveness in reducing emissions and limiting temperature rise. Together, they provide the context for a Renewable Energy Technologies module, where attention turns to the role of renewables and other low-carbon technologies as climate solutions. The central takeaway is that there is no single “silver bullet” solution; instead, a coordinated “silver buckshot” approach is essential.
Learners do not require any prior learning in the area of climate change or climate solutions for these workshops. The workshops are the perfect introduction to these. Climate Fresk facilitator training begins with attending a workshop as a participant, followed by a session on facilitation. Staff can train via local workshops, the CF MOOC and peer-to-peer practice, or through official training, enabling institutions to build a self-sustaining community of facilitators at minimal cost.
Learners have the opportunity to:
Learn about the climate science that underpins the IPCC assessment reports.
Develop an understanding of systems thinking by applying it to climate science and the impacts of climate change, while also exploring the policy solutions needed to drive systems-level change.
Be Introduced to the En-Roads Climate Simulator tool and the possibility of becoming trained Climate Fresk Facilitators themselves.
Teachers have the opportunity to:
Actively engage the students in taking a systems thinking approach to their understanding of ‘the problem’ of climate change, and exploring ‘the solutions’ to it.
Use these workshops as stand-alone activities (for outreach) or embed within the curriculum.
Collaborate with other teachers and students, by training them as facilitators to support future workshops.
Engage students with different competencies such as systems thinking, critical thinking, and anticipatory thinking and highlight to students how these are relevant and applied.
Downloads: A PDF of this resource will be available soon.
This activity utilises off-the-shelf educational tools in the form of the Climate Fresk workshop and the En-Roads Climate Simulator tool. These are used in two separate (but connected) workshops adapted from the guided assignment that is presented in the resources above. These are not intended to be run back-to-back. In fact, some gap (of days) in between is desirable as together, this would be too exhausting, and also give time for reflection in between.
The Climate Fresk workshop is designed to build a solid understanding of cause-and-effect in climate systems. This develops baseline systems thinking without overloading students.
En-ROADS, is designed to engage students with the types of sectors that we need to decarbonise and get them thinking about the need for system wide policies to achieve system wide decarbonisation of our energy system.
Figure 1. Using Climate Fresk and En-ROADS as complementary workshops focusing on ‘the climate problem’ and ‘climate solutions’.
A key aspect of both workshops is highlighting the need for systems thinking in both understanding the problem of, and exploring the solutions to, climate change. This involves introducing students to the cause and effects of climate change, feedback loops and the concept of tipping points – both in terms of climate tipping points (BBC Sounds – The Climate Tipping Points, no date) that can potentially trigger irreversible changes in the climate system, as well as positive, social tipping points (TEDx Talks 2023) that once crossed can shift social norms, and how policies can affect this. It allows discussions around leverage points in the context of climate solutions and policies, which Donella Meadows describes as where “a small shift in one thing can produce big changes in everything”.
Part one: Climate Fresk workshop:Understanding the problem of climate change (or the ‘science piece’):
Overview:
Climate Fresk is a 2-2.5 hour facilitator-led gamified workshop based on the latest IPCC report, where participants work in groups to build a causal-loop diagram (or fresk) of the Earth’s climate system using specially designed cards. The activity encourages discussion, challenges assumptions, and develops systems thinking by illustrating the interconnections, feedback loops, and tipping points of climate change. In doing so, it supports UNESCO Education for Sustainable Development competencies in anticipatory and systems thinking, helping participants understand the potential impacts of climate dynamics on ecological, social, and economic systems in a way that is accessible.
Scalability and setup:
The Climate Fresk workshop can be delivered to almost any number of participants, limited only by the size of the space, the number of trained facilitators available, and the number of card decks. Participants are usually divided into groups of 8 (10 at a push), each working around a table roughly 2m x 1m in size. Each group (table) requires a dedicated facilitator to guide the process.
Facilitation and training:
Facilitators must be trained before running the activity. Training can be undertaken through official Climate Fresk courses (see resources) or, once enough experience has been built, in-house peer-to-peer training supported by staff development units. Facilitators use a “crib sheet” containing guiding questions and timings to help keep groups on track.
Workshop materials:
The Fresk uses a deck of 42 cards, each representing a cause, effect, or impact within the climate system-ranging from fossil fuel use across industry, buildings, transport and agriculture, to wider impacts on society, biodiversity, and ecosystems. Each card has a graphic on one side and explanatory text on the other, which participants use to determine its role in the system.
Learning process:
Over the session, participants collaboratively arrange the cards on a large sheet of paper to construct a causal-loop diagram of the climate system. In doing so, they identify drivers of carbon emissions, critical carbon sinks, feedback loops, and potential tipping points. The activity encourages discussion, challenges assumptions, and introduces key climate science terminology, while making visible the complex interdependencies of Earth systems.
Reflection and discussion:
After constructing the Fresk, participants are encouraged to reflect on how the process made them feel (normative competency) and what insights they gained. This is followed by open discussion on mitigation strategies and possible solutions. In a standard Climate Fresk workshop, around 45 minutes is devoted to this. However, when combined with the En-Roads simulator, this discussion naturally transitions from the “problem space” of the Fresk workshop to the “solutions space” of the subsequent En-Roads workshop, where participants explore the realistic impacts of different climate solutions, their co-benefits, and the equity issues they raise – engaging participants in deeper systems-level thinking.
Part two: En-ROADS workshop:‘Exploring the solutions’ to climate change (or the ‘policy piece’):
Overview:
This En-ROADS workshop can be run from one to two hours, and can follow a role-play format, where participants are asked to take on the role of policymakers, exploring different policy options to limit global temperatures to 1.5oC (or 2oC). They are introduced to the workshop by telling them “you are policymakers tasked with limiting global heating”. En-Roads is a climate change simulator developed by Climate Interactive and MIT that uses roleplay to explore global policy interventions for limiting temperature rise. It enables participants—from students to policymakers—to test combinations of climate solutions, examine trade-offs and unintended consequences, and understand that no single “silver bullet” exists. The workshop develops UNESCO Education for Sustainable Development competencies in anticipatory, systems, critical, and strategic thinking, while highlighting the challenges of achieving policy consensus across diverse stakeholders.
Preparation:
1. Participants
Suitable for classes split into small groups.
Works well in groups of 3–5 for discussions.
2. Facilitators
1 facilitator to introduce the tool and guide reflection.
Teaching assistants can circulate during group tasks to prompt discussion.
Handouts: list of possible climate “levers” (policy actions) – See resources – En-Roads Control Panel
Online polling software (e.g. Mentimeter)
Step-by-step instructions for 60-minute workshop (but can be expanded to 2 hours involving more discussion and more interaction with En-Roads simulator):
1. Introduction (5 mins)
Introduce EN-ROADS as an interactive simulator for testing climate solutions.
Explain the goal: Can we keep global heating below 1.5 °C?
Use causal loop diagram below to demonstrate how mitigating actions effect positive change.
Figure 2. Causal loop diagram showing how increasing GHG emissions drive climate action and emissions reduction.
2. Initial actions brainstorm (5 mins)
Ask cohort to use an online polling system, asking them to vote for their Topaction (from the list of mitigating actions – see resources – En-Roads Control Panel) that that they think will have the greatest impact on reducing emissions and temperature.
Figure 3. Example of a Menti poll to capture learners’ understanding of climate solution impacts.
Don’t show this yet – keep this for later, when you will ask them to vote again and can then compare how their views have changed from beginning to end of session.
Ask participants to self-sort into groups of 3–4, and now ask them to discuss what their Top 3 actions would be – they must agree on these.
3.Using EN-ROADS (15 mins)
As facilitator, ask one group to volunteer their top action. Demonstrate their action using the simulator with an example (e.g. applying a coal phase-out or carbon tax).
IMPORTANT: Before you implement the action – ask the group (and others) what they expect to happen to emissions and temperature.
Apply their action and ask if it is what they expected. Then discuss why it is, or is not, what they expected to see.
Highlight unintended consequences (e.g. rising energy prices and discussion on the real-world impacts this can have on local communities or households, land-use impacts).
This does require the facilitator to be familiar with the simulator and what these impacts might be and how to use the simulator to show these (there is a Climate Interactive course available (Training, no date), which is free, and there are also many resources available for individuals to work through at their own pace).
Can repeat this with other groups volunteering their top action. Ask for a group who has a different top action, or ask a group for their second top action to ensure you cover different levers.
4. Group simulation (15 mins)
Ask groups to now use En-Roads to consider other levers to get temperature as close to 1.5oC as possible, to determine whether their initial top 5 ranking has changed.
They should record how much each action reduces emissions and temperature rise.
Take the poll again.
Show both polls and look at differences – have they changed their views on certain actions – ask them why.
Discuss: Which actions had the biggest effect? Which had less than expected? Why?
5. Achieving 1.5 °C (10 mins)
Ask who reached 1.5oC
Ask them to show their combined actions.
Open up for discussion on how feasible these actions look – what are the implementation challenges associated with them. Are there risks of unintended consequences such as GDP, equity, biodiversity, etc?
6. Reflection and debrief (5 mins)
Discuss key takeaways:
The importance of combining multiple actions (“silver buckshot” rather than a silver bullet).
Trade-offs and co-benefits (e.g. health, equity, biodiversity).
The role (and challenge) of collaboration and consensus in policy decisions.
7. Post Workshop – optional
Challenge groups to adjust policies and combinations of levers to approach the IEA’s Net Zero 2050 (1.5 °C) pathway, and compare their pathways with this. Gives them a sense of how challenging/possible the net-zero pathway will be.
Any views, thoughts, and opinions expressed herein are solely that of the author(s) and do not necessarily reflect the views, opinions, policies, or position of the Engineering Professors’ Council or the Toolkit sponsors and supporters.
 Peter Martin, Director of Research & Development at Quanser, and co-chair of the Complex Systems Toolkit Working Group, reflects on the importance of engineers understanding complex systems when working in the field of intelligent robotics.
 Peter Martin, Director of Research & Development at Quanser, and co-chair of the Complex Systems Toolkit Working Group, reflects on the importance of engineers understanding complex systems when working in the field of intelligent robotics.