
![]() Toolkit: Complex Systems Toolkit.
Toolkit: Complex Systems Toolkit.
Author: Professor Robert Geyer (Lancaster University).
Topic: Complexity and engineering policy.
Title: A tool for thinking about complex systems and policy.
Resource type: Knowledge article.
Relevant disciplines: Any.
Keywords: Law or Policy; Stacey Matrix; Politics; Decision making; Personal values.
Licensing: This work is licensed under a Creative Commons Attribution-ShareAlike 4.0 International License.
Downloads: A PDF of this resource will be available soon.
Learning and teaching resources:
Who is this article for?: This article should be read by educators at all levels in higher education who are seeking an understanding of the connection between complex systems in engineering education and public policy.
Related INCOSE Competencies: Toolkit resources are designed to be applicable to any engineering discipline, but educators might find it useful to understand their alignment to competencies outlined by the International Council on Systems Engineering (INCOSE). The INCOSE Competency Framework provides a set of 37 competencies for Systems Engineering within a tailorable framework that provides guidance for practitioners and stakeholders to identify knowledge, skills, abilities and behaviours crucial to Systems Engineering effectiveness. A free spreadsheet version of the framework can be downloaded.
This resource relates to the Systems Thinking and Critical Thinking INCOSE competencies.
AHEP mapping: This resource addresses several of the themes from the UK’s Accreditation of Higher Education Programmes fourth edition (AHEP4): Analytical Tools and Techniques (critical to the ability to model and solve problems), and Integrated / Systems Approach (essential to the solution of broadly-defined problems). Additionally, this resource addresses the Communication theme.
Premise:
In engineering there is often a direction/endpoint: the building is completed, the project finalised, the product made. In policy, different groups want different things: the goals may shift and the values become contested, uncertain, and emergent (depending on ‘events’) – more of an on-going ‘dance’ than a final outcome. So what happens when the relatively simple/complicated field of engineering and physical systems bump into the complex/chaotic and often tumultuous, emotional, and values-laden arena of public policy?
Engineering complexity and public policy:
For the past 30+ years, there has been a growing literature on complex systems/complexity and policy making, and more recently, increasing work within UK government circles (2023 UK Systems Thinking Toolkit ; 2020 Magenta Book – Handling Complexity in Policy Evaluation) on how to use systems and complex systems thinking to better understand public policy. This short article introduces one popular tool for conceptualising complexity and policy: the Complexity Diagram (also known as a Stacey Diagram/Matrix) and how it can help people to see the larger policy picture and an engineer’s role in it.
The diagram was originally developed by Professor Ralph Stacey in the 1990s and has been used widely in complexity and systems thinking (including in the aforementioned 2020 Magenta Book). The description below is from Geyer and Rihani (2010), and there is also a related YouTube video.
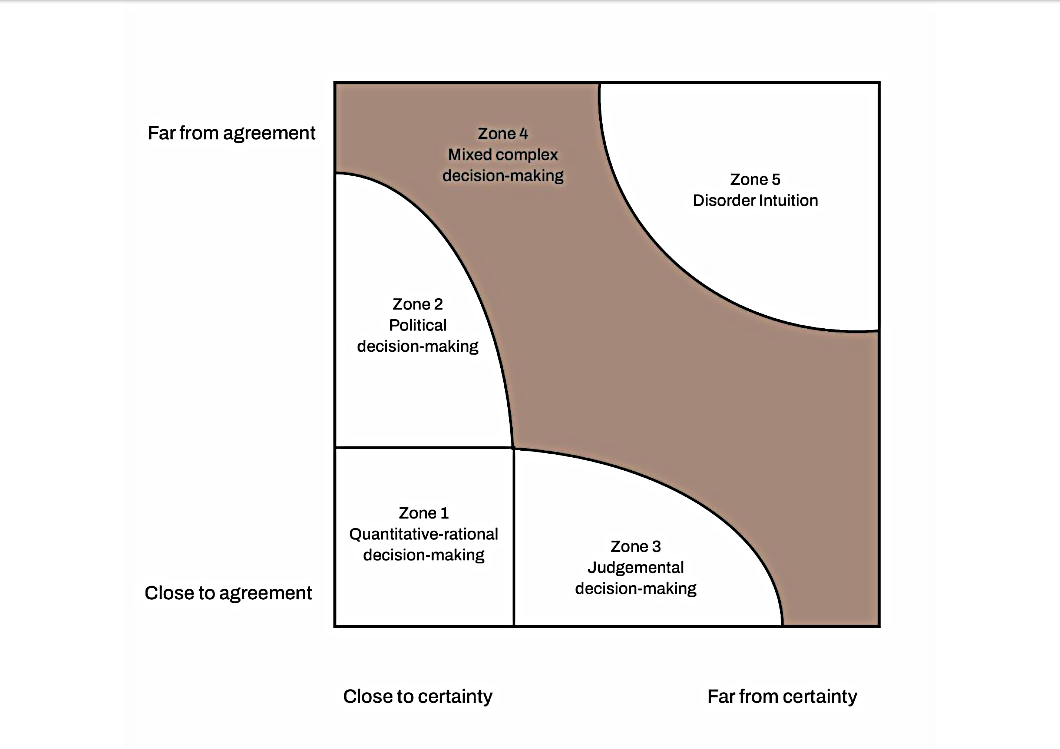
Figure 1: A Version of the Complexity Diagram. Harrison and Geyer (2022).
As shown in Figure 1, the Complexity Diagram combines two axes based on the degree of certainty and the degree of agreement for a particular policy area. High levels of certainty indicate that the issue is well known, understood, and data is available, while low levels of certainty imply that it is unknown and contested with poor or no data. Meanwhile, high levels of agreement denote substantial public agreement over the issue and its solution, while low levels of certainty imply substantial public debate and disagreement. These two axes create five main zones of decision-making:
- Zone 1 (Quantitative-rational): high certainty-high agreement. The issue is well understood, and the policy response agreed between the majority of key stakeholders. Data is clear, abundant and easily accessible. Evidence-based actions and audit and targeting strategies work well here.
- Zone 2 (Political): high certainty-low agreement. Data is clear and abundant, and the experts/actors understand the problem. However, the stakeholders disagree over the solution/response. More evidence is of little use and political bargaining, and consensus-building become key decision-making tactics.
- Zone 3 (Judgemental): low certainty-high agreement. All the main actors agree about the nature of the issue, but there is no simple policy response to the problem. Available data may be contradictory, and more data may only increase the uncertainty. Experts do not know how to properly respond to it. Multiple strategies may be required, and discretionary decision-making becomes increasingly important.
- Zone 4 (mixed complex): mixed certainty-mixed agreement. Data may be uncertain and contested. Stakeholders and experts disagree, to varying levels, over the nature of, and responses to the issue. This requires a flexible response that blends political decision-making with evidence-based processes and discretionary decision-making.
- Zone 5 (disorder/intuition): low certainty-low agreement. Data is negligible, unclear and untrustworthy. There is significant disagreement and no clear answer. Evidence is very poor, limited and continually shifting. Moreover, the issue may be highly emotive and politicised, effectively nullifying evidence-based strategies. Intuitive responses based on emotional intelligence/skills may be just as important as evidence-informed thinking.
It is important to note that the complexity diagram can be applied to any level of policy.
Complexity and policy in practice:
At a local level, one example of the complexity diagram in practice would be the need for transmission masts that emerged with the development of mobile phones. The technological need for some form of mast system was relatively clear and particular specifications (distance of coverage, etc.) could be mapped out. However, there was substantial political disagreement over where they should be placed (In which neighbourhoods? Near schools?). Moreover, there were clear judgemental debates over whether the masts could or should be disguised (What was the best disguise? How much should locals be involved in making these decisions?). In many areas, decisions over mast placements were a mixture of technical demands, political consultation and debate, and chance (having easily accessible land and infrastructure available). Occasionally, they involved the techno-social fears of physical harm and led to protests and occasional acts of destruction against masts.
At a national/global level, one can easily see climate change as a case for using the Complexity diagram. The evidence for climate change is very clear. Engineering a solution to it is relatively straightforward – reduce CO2 outputs. However, as demonstrated by the continued lack of global/national consensus, the politics surrounding this are fraught with different values and political debates are clearly part of the process for resolving this issue. At the same time, there is substantial debate over the specific type of transformation required (reduce consumption, green energy, nuclear power), even by the experts, and judgemental decisions linked to particular situations will be needed as well. Clearly, a mix of approaches is essential, particularly in relation to strong emotional elements that the issue generates.
Does the Stacey Diagram solve all of these difficulties? NO! However, it does allow students to recognise that there are a range/spectrum of policy systems and system dynamics and not a hierarchy with quantitative-rational/evidence-based approaches at the top. When confronting a complex problem embedded in physical and human systems (building a new hospital, altering an urban electrical grid, changing a road system), engineering students should try to recognise the type of zone they are dealing with and adjust their approach to fit the situation. Using the diagram to reflect on this range and choose the right approach for the right situation is fundamental to learning that the engineer’s role in society is more than just a builder of things. She/he may also be playing a key role in social/political debates and policy choices that will continually change over time and place. Hence, the policy world is more akin to a dance with multiple actors, often pulling in different directions, than orderly Newtonian science.
References:
- Bicket, M., Gilbert, N., Hills, D., Penn, A. and Wilkinson, H. (2025) HM Treasury (Magenta Book) Supplementary Guide: Handling Complexity in Policy Evaluation (HTML). https://www.gov.uk/government/publications/the-magenta-book/supplementary-guide-handling-complexity-in-policy-evaluation-html#fn:1
- Byrne, D. and Callaghan, G. (2022) Complexity Theory and the Social Sciences: The State of the Art (2nd edition). London: Routledge.
- Eppel, E. and Rhodes, M. (eds.) (2020) Complexity Theory in Public Administration, London: Routledge.
- Harrison, N. and Geyer, R. (2022) Governing Complexity in the 21st Century, London: Routledge.
- Geyer, R and Rihani, S. (2010) Complexity and Public Policy, London: Routledge.
- Haynes, P. (2015) Managing Complexity in the Public Services. New York: Routledge.
- Morçöl, G. (2012) A Complexity Theory for Public Policy, New York: Routledge.
- Room, G. (2011) Complexity, Institutions and Public Policy: Agile Decision-making in a Turbulent World. Cheltenham: Edward Elgar Publishing.
- Stacey, R. (1993) Strategic Management and Organizational Dynamics. London: Financial Times/Prentice Hall.
- UK Government Office for Science, (2023) An Introductory Systems Thinking Toolkit for Civil Servants. https://www.gov.uk/government/publications/systems-thinking-for-civil-servants/toolkit
Any views, thoughts, and opinions expressed herein are solely that of the author(s) and do not necessarily reflect the views, opinions, policies, or position of the Engineering Professors’ Council or the Toolkit sponsors and supporters.