
![]()
Toolkit: Complex Systems Toolkit.
Author: Dr Raja Toqeer CEng, MIET, CMgr, FCMI, FHEA, iPEER (University of Sheffield).
Topic: Methods and tools used to embed complex systems in engineering education.
Title: High-level overview of complex systems methods and tools.
Resource type: Guidance article.
Relevant disciplines: Any.
Keywords: Available soon.
Licensing: This work is licensed under a Creative Commons Attribution-ShareAlike 4.0 International License.
Who is this article for?: This article should be read by educators at all levels in higher education who are seeking an overall perspective on teaching approaches for integrating complex systems in engineering education.
Related INCOSE Competencies: Toolkit resources are designed to be applicable to any engineering discipline, but educators might find it useful to understand their alignment to competencies outlined by the International Council on Systems Engineering (INCOSE). The INCOSE Competency Framework provides a set of 37 competencies for Systems Engineering within a tailorable framework that provides guidance for practitioners and stakeholders to identify knowledge, skills, abilities and behaviours crucial to Systems Engineering effectiveness. A free spreadsheet version of the framework can be downloaded.
This resource relates to the Systems Thinking, Systems Modelling and Analysis, and Critical Thinking INCOSE competencies.
AHEP mapping: This resource addresses several of the themes from the UK’s Accreditation of Higher Education Programmes fourth edition (AHEP4): Analytical Tools and Techniques (critical to the ability to model and solve problems), and Integrated / Systems Approach (essential to the solution of broadly-defined problems). Additionally, this resource addresses the Problem Analysis theme.
Downloads: A PDF of this resource will be available soon.
Learning and teaching resources:
- Glossary: This article refers to many concepts and terms which are more fully described and explained in this companion resource.
- Introduction to the Modeling and Analysis of Complex Systems – Open Textbook Library – Hiroki Sayama’s open textbook (2015).
- Complexity Explorer – Free courses and tutorials on complexity science (Santa Fe Institute).
- Systems Innovation Resources – Guides and tutorials for applying systems thinking and complexity:
- Accessible modelling/simulation/visualisation tools:
-
- Insight Maker | Build simulations and models for free – Free web-based system dynamics and agent-based simulation tool.
-
- NetLogo – Free agent-based modelling platform with an extensive model library
-
- Gephi – The Open Graph Viz Platform – Open-source network analysis and visualization software.
Premise:
From smart cities and power grids to global supply chains, complex systems undeniably form the backbone of modern engineering challenges, integrating diverse technical and human domains to deliver resilient solutions that are capable of addressing emerging global demands. Traditional engineering approaches are limited in their ability to address increasingly complex and nonlinear problems, as they often fail to consider systems holistically. Complex systems exhibit dynamic behaviours and patterns that emerge from interactions within the whole, offering insights that go beyond what can be deduced from individual components (Martin, 2025).
However, recognising complexity alone is insufficient. To engage meaningfully with such systems, engineers and educators require systematic methods and analytical tools that make the structure, behaviour, and evolution of complex systems more transparent and tractable. Methods such as system dynamics, network analysis, agent-based modelling and causal loop mapping enable the identification of affected points, feedback mechanisms and unintended consequences providing a structured way to explore “what if” scenarios and support informed decision making. Without these tools, understanding remains largely intuitive and fragmented, limiting the capacity to model interactions, predict emergent behaviours or design resilient interventions.
There are many different ways to model complex systems, each suited to exploring particular types of interactions, timeframes, or behaviours. The following sections outline several commonly used tools and illustrate the contexts in which they can be effectively applied within engineering education. This guidance therefore focuses on the practical application and pedagogical integration of key complex systems methods and tools, with the aim of equipping engineering educators to embed systems thinking effectively in their teaching and practice.
Systems thinking and mapping tools:
Systems thinking provides a holistic perspective for students to explore the interdependencies, feedback loops, and emergent behaviours that characterise complex engineering challenges. A range of mapping and modelling tools can be used to visualise and analyse system structures and behaviours. These tools can be broadly categorised into three categories: qualitative mapping tools (such as rich pictures and influence diagrams) that support shared understanding and problem framing; causal modelling tools (such as causal loop diagrams) that reveal feedback structures and dynamic behaviour; and quantitative simulation tools (such as system dynamics models) that enable experimentation and testing of hypotheses.
Rich pictures, influence diagrams and causal loop diagrams are adaptable for both conceptual exploration and analytical modelling in engineering education. Each offers distinct advantages and limitations. Rich pictures are highly flexible, enabling diverse stakeholders to collaboratively capture multiple perspectives of a system. Their visual and narrative style promotes inclusivity and creativity but can lack analytical precision and consistency between users. Influence diagrams provide a more structured representation by showing directional relationships between variables, supporting clearer causal reasoning and decision making. However, they do not capture feedback or temporal dynamics, which limits their use in modelling evolving systems. Causal loop diagrams offer an advantage as they explicitly map, reinforcing and balancing feedback loops, giving powerful insights into system behaviour over time. However, these can become complex and difficult to interpret without adequate guidance and their qualitative nature may oversimplify quantitative relationships. When used in sequence, these tools can scaffold students’ systems thinking skills from exploratory mapping (rich pictures), through structural reasoning (influence diagrams), to dynamic analysis (causal loop diagrams). Embedding this progression in engineering education not only enhances students’ critical and reflective capabilities but also enables them to identify leverage points, anticipate unintended consequences and design resilient solutions that respond effectively to the complexity of real-world complex systems.
Figure 1 presents a product causal loop diagram illustrating how product quality, sales, investment and profitability interact through reinforcing and balancing feedback loops. Two reinforcing loops (R1 and R2) show how profitability and product quality can drive self-sustaining growth: higher profits enable reinvestment in sales, while improved quality enhances customer satisfaction and market demand, both improving overall performance. In contrast, two balancing loops (B1 and B2) act as stabilising forces. When rapid sales growth strains production capacity, quality declines, prompting corrective investment to restore standards (B1). Meanwhile, as quality improves, it eventually reaches a maximum threshold where further gains lead to diminishing returns (B2), reflecting real-world technological and resource limits. Together, these loops demonstrate the dynamic interaction between growth and constraint in complex systems. The model highlights how feedback processes shape organisational performance and underscore the value of systems thinking for anticipating unintended consequences and supporting sustainable decision making in educational contexts where understanding system dynamics enhances learning and design practice.
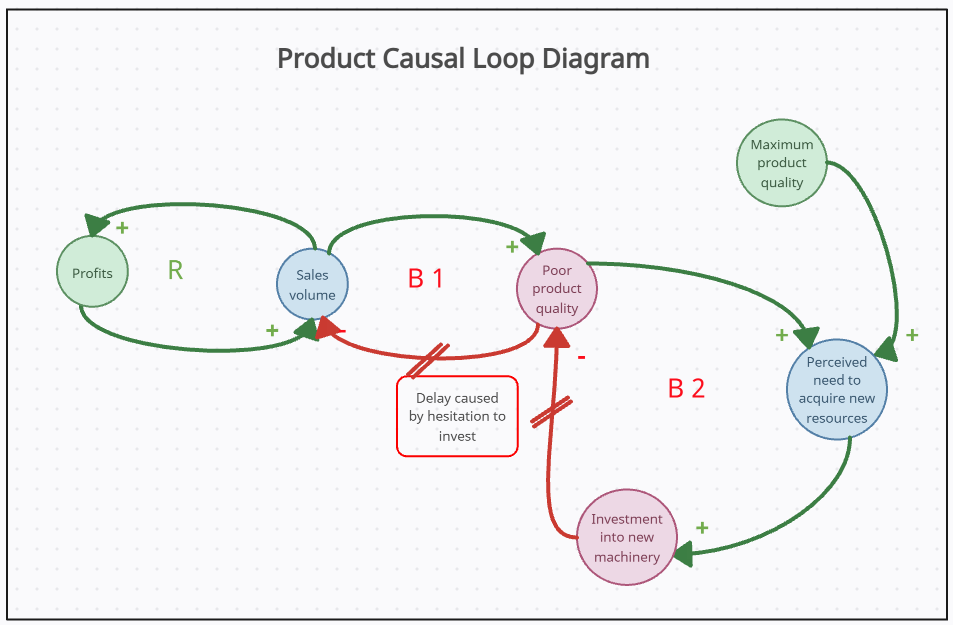
Figure 1. Product causal loop diagram (Credit: Creately)
System dynamics modelling:
System dynamics (SD) models simulate system behaviour over time by representing key elements such as stocks, flows, feedback loops, and time delays. This approach is particularly useful for understanding long-term patterns and testing interventions in complex contexts, such as modelling energy demand, tracking carbon emissions, or optimising supply chain dynamics. By using accessible tools like Stella, Vensim, or Insight Maker, educators can create interactive learning experiences that allow students to experiment with ‘what-if’ scenarios, deepen their understanding of dynamic behaviours, and develop the skills needed to make informed, data-driven decisions. Figure 2 illustrates a dynamic stock-and-flow diagram of a model for new product adoption. The diagram demonstrates how stock and flow structures can capture accumulations and delays within a system, providing insights into how adoption rates evolve over time in response to feedback processes.
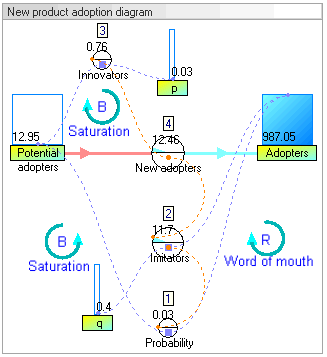
Figure 2. Dynamic stock and flow diagram of model New product adoption (taken from Wikipedia: model from article by John Sterman 2001 - True Software)
Agent-based modelling:
Agent-Based Modelling (ABM) analyses complex systems by simulating the actions and interactions of many individual “agents” each following simple behavioural rules. Agents can represent people, vehicles, organisations or even machines depending on the context and their collective behaviour gives rise to larger system patterns that are often unexpected or counterintuitive. For example, in a traffic flow model, each car (agent) follows basic rules for acceleration, braking and lane changing. While these rules are simple in isolation, their combined effects can lead to emergent phenomena such as traffic jams or wave-like congestion patterns, behaviours not explicitly programmed into the system. Similarly, in a disease transmission model, each agent might represent a person whose movement and interactions influence infection spread across a population, providing valuable insight into intervention strategies.
ABM is particularly useful in systems where differences among agents and local interactions matter. Whereas System Dynamics (SD) captures aggregate feedback through mathematical relationships, ABM reveals the distributional and spatial dimensions of system behaviour by modelling individual actions and decisions. Educators may choose ABM to help students see how microscale decisions lead to macroscale outcomes, reinforcing the concept that system-level order often emerges from local and uncoordinated interactions. Open-source platforms such as NetLogo provide accessible environments for teaching these principles, offering pre-built models that allow students to experiment with agent rules and parameters. Through such interactive exploration, engineering students can observe how small behavioural changes can cascade into large-scale effects deepening their understanding of emergence, adaptability and complexity in real-world complex systems. Figure 3 presents a schematic of an agent-based model, illustrating how interactions among individual agents within an artificial environment can lead to emergent system-wide patterns.
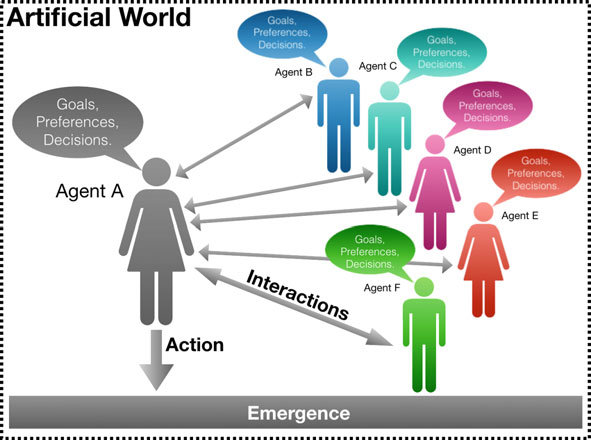
Figure 3. Schematic of an agent-based model, showing how interactions between agents lead to emergent phenomena within an artificial world (Credit to Agent-Based Modeling and the City: A Gallery of Applications, Crooks, A., et al 2021).
Network analysis and modelling:
Network analysis looks at how the pattern of connections within a system affects how it behaves, performs, and recovers from disruption. Instead of focusing on individual parts, this approach studies the relationships between elements whether they are people, machines, or data points and how these connections shape the overall outcome of the system. In network science, two important ideas help describe how a network is organised: degree distribution and clustering coefficients. Degree distribution shows how many connections (or “links”) each element, known as a node, has. If most nodes have a similar number of links, the network tends to behave in a steady and predictable way. However, if a few nodes have many more connections such as major airports in a flight network, the system can operate very efficiently but may also become more vulnerable if one of those key nodes fails. Clustering coefficients measure how connected a node’s neighbours are to each other. A high clustering coefficient means that a node’s connections are also well connected, forming strong local groups. This structure can improve communication and resilience within the network, though it may also limit flexibility or slow the spread of new information.
By analysing these features, students learn that the way parts of a system are connected is just as important as the parts themselves. Real-world complex systems examples include power grids, transport networks, and organisational systems, where understanding connectivity helps engineers identify weaknesses and design for greater robustness. Tools such as Gephi and NetworkX make it possible to visualise and measure these network properties, helping turn complex data into clear, interpretable diagrams. Figure 4 shows the structure and properties of a technological network, illustrating how node connectivity and clustering together influence the system’s overall resilience.
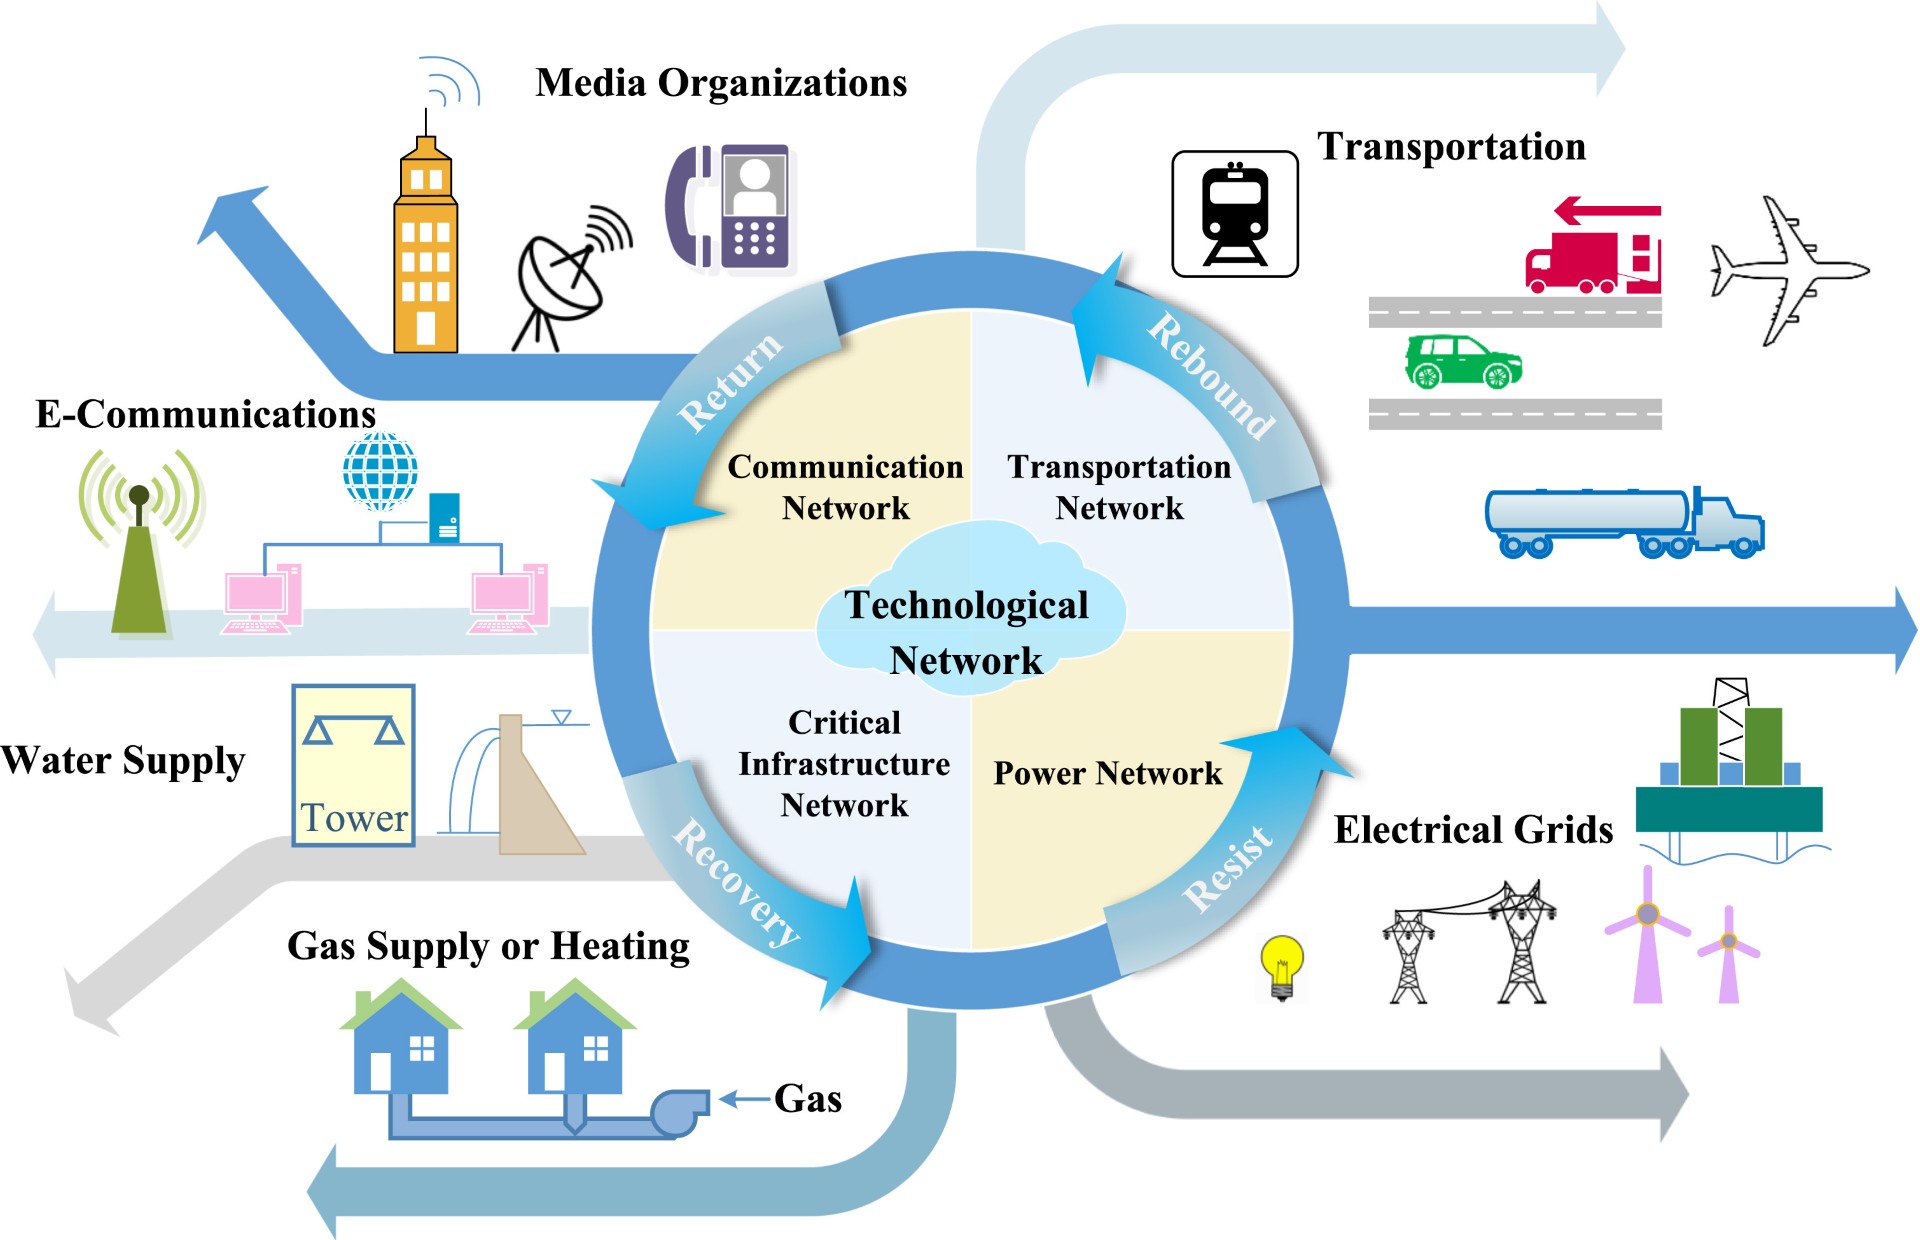
Figure 4. Composition and properties of technological network (Credit to Network Resilience: Definitions, approaches, and applications by Xiaoyu Qi and Gang Mei).
Conclusion:
Understanding and managing complexity is now an essential skill for modern engineers. By gradually introducing students to different systems thinking tools from qualitative mapping to dynamic simulation and network analysis, educators can help them build a deep and transferrable understanding of how complex systems behave. Each tool offers a different perspective: mapping tools encourage exploration and shared understanding, dynamic models reveal feedback and time-based behaviour, and network analysis exposes structural patterns and resilience. Taken together, these approaches form a developmental pathway that strengthens students’ ability to think critically, reason systematically, and make informed design and management decisions. Embedding this progression within engineering education cultivates curiosity, adaptability, and a mindset equipped to tackle the interconnected social, environmental and technological challenges of the future. In doing so, educators prepare graduates not just to work with complex systems, but to improve and transform them.
References:
- Avison, D. E., Golder, P. A. and Shah, H. U. (1992) ‘Towards an SSM toolkit: rich picture diagramming’, European Journal of Information Systems, 1(6), pp. 397–408. doi.org/10.1057/ejis.1992.17
- Barabási, A.-L. & Albert, R. (1999) ‘Emergence of scaling in random networks’, Science, 286(5439), pp.509-512. doi: 10.1126/science.286.5439.509
- Bonabeau, E. (2002) ‘Agent-based modeling: Methods and techniques for simulating human systems’, PNAS, 99 (Suppl_3), 7280–7287. doi.org/10.1073/pnas.082080899
- Checkland, P. (1981) Systems Thinking, Systems Practice, Chichester: John Wiley & Sons.
- Forrester, J.W. (1997) ‘Industrial dynamics’, Journal of the Operational Research Society, 48(10), pp.1037-1041.
- Martin, P. (2025) ‘The EPC Complex Systems Toolkit for Engineering Education – Greater Than the Sum of Its Parts’, Quanser Blog, 18 June 2025. Accessed online 27 August 2025: https://www.quanser.com/blog/engineering-education/complex-systems-toolkit-for-engineering-education/
- Sterman, J.D. (2000), Business Dynamics: Systems Thinking and Modeling for a Complex World, Boston, MA: Irwin/McGraw-Hill. Accessed online 27 August 2025: https://dspace.mit.edu/handle/1721.1/102741
Any views, thoughts, and opinions expressed herein are solely that of the author(s) and do not necessarily reflect the views, opinions, policies, or position of the Engineering Professors’ Council or the Toolkit sponsors and supporters.