Author: Dr Lampros Litos (Cranfield University).
Topic: Sustainability in manufacturing.
Tool type: Guidance.
Engineering disciplines: Aeronautical; Manufacturing, Mechanical.
Keywords: Energy efficiency; Factories; Best practice; Eco-efficiency; Practice maturity model; AHEP; Student support; Sustainability.
AHEP mapping: This resource addresses two of the themes from the UK’s Accreditation of Higher Education Programmes fourth edition (AHEP4): The Engineer and Society (acknowledging that engineering activity can have a significant societal impact) and Engineering Practice (the practical application of engineering concepts, tools and professional skills). To map this resource to AHEP outcomes specific to a programme under these themes, access AHEP 4 here and navigate to pages 30-31 and 35-37.
Related SDGs: SDG 9 (Industry, innovation, and infrastructure); SDG 12 (Responsible consumption and production).
Learning and teaching notes:
The following are a set of use cases for a maturity model designed to improve energy and resource efficiency in manufacturing facilities. This guide can help engineering educators integrate some of the main concepts behind this model (efficient use of energy and resources in factories in the context of continuous improvement and sustainability) into student learning by showcasing case study examples.
Teachers could use one or all of the following use cases to put students in the shoes of a practicing engineer whose responsibility is to evaluate and improve factory fitness from a sustainability perspective.
Supporting resources:
- Siemens – Sustainability as decision factor in manufacturing
- Litos, L., Patsavellas, J., Afy-Shararah, M. and Salonitis, K. (2023). An investigation between the links of sustainable manufacturing practices and innovation. Procedia CIRP, 116, pp.390395.
- Litos, L., Gray, D., Johnston, B., Morgan, D. and Evans, S. (2017). A Maturity-based Improvement Method for Eco-efficiency in Manufacturing Systems. Procedia Manufacturing, 8, pp.160–167.
- Litos, L., Lunt, P., Liu, W. and Evans, S. (2017). Organizational Designs for Sharing Environmental Best Practice Between Manufacturing Sites. Advances in Production Management Systems. The Path to Intelligent, Collaborative and Sustainable Manufacturing, pp.427–434.
- Despeisse, M., Davé, A., Litos, L., Roberts, S., Ball, P. and Evans, S. (2016). A Collection of Tools for Factory Eco-efficiency. Procedia CIRP, 40, pp.542–546.
- Litos, L. (2016). Design support for eco-efficiency improvements in manufacturing p. 218.
Factory assessment in multiple assembly facilities for an aircraft manufacturer:
The assessment is part of the following use case on this industrial energy efficiency network (IEEN):
| The company operates in the aerospace sector and runs 11 manufacturing sites that employ approximately 50000 people across 4 European countries. Most of the sites are responsible for specific parts of the aircraft i.e. fuselage, wings. These parts once manufactured are sent to two final assembly sites. Addressing energy efficiency in manufacturing has been a major concern for the company for several years.
It was not until 2006 that a corporate policy was developed that would formalize efforts towards energy efficiency and set a 20% reduction in energy by the year 2020 across all manufacturing sites. An environmental steering committee at board level was set up which also oversaw waste reduction and resource efficiency. The year 2006 became the baseline year for energy savings and performance measures. Energy saving projects were initiated then, across multiple manufacturing sites. These were carried out as project-based activities, locally guided by the heads of each division and function per site.
A corporate protocol for developing the business case for each project is an initial part of the process. It is designed to assign particular resources and accountabilities to the people in charge of the improvements. Up to 2012, improvement initiatives had a local focus per site and an awareness-raising character. It was agreed that in order to replicate local improvements across the plants a process of cross-plant coordination was necessary. A study on the barriers to energy efficiency in this company revealed three important barriers which needed to be addressed:
The solution that the environmental steering committee decided to support, was the creation of an industrial energy efficiency network (IEEN). The company had previously done something similar when seeking to harmonize its manufacturing processes through process technology groups (Lunt et al., 2015). This approach consists of each plant nominating a representative who is taking the lead and coordinating activities. It is expected that the industrial network would contribute to a significant 7% share out of the 20% energy reduction target for the year 2020 since its establishment as an operation in 2012.
The network’s operations are further facilitated with corporate resources such as online tools that help practitioners report and track the progress of current projects, review past ones, and learn about best-available techniques. This practice evolved into an intranet website that is further available to the wider community of practitioners and aims to generate further interest and enhance the flow of information back to the network. Additionally, a handbook to guide new and existing members in engaging effectively with the network and its objective has been developed for wider distribution. These tools are supported by training campaigns across the sites.
Most of the network members also act as boundary spanners (Gittell and Weiss, 2004) in the sense that they have established connections to process technology groups or they are members of these groups as well. This helps the network establish strong links with other informal groups within the organization and act as conductor for a better flow of ideas between these groups and the network. Potentially, network members have a chance to influence core technology groups towards energy efficiency at product level.
On average, a 5-10% work-time allocation is approved for all network members to engage with the network functions. In case a member is not coping in terms of time management there is the option of sub-contracting the improvement project to an external subcontractor who is hired for that particular purpose and the subcontractor’s time allocation to the project can be up to 100%.
“….by having the network we meet and we select together a list of projects that we want to put forward to access that central pot of money. So we know roughly how much will be allocated to industrial energy efficiency and so we select projects across all of the sites that we think will get funded and we put them all together as a group…so rather than having lots of individual sites making individual requests for funding and being rejected, by going together as a group and having some kind of strategy as well…” |
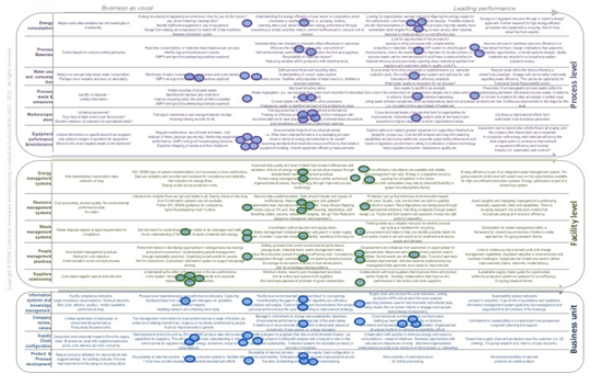
Each dot on each of the model rows represents the relative efficiencies that a factory achieves in saving energy and resources through best practice (5 of 11 factories represented here, each delivering an aircraft part towards final assembly). The assessment allowed this network of energy efficiency engineers and managers to better understand the strengths and weaknesses in different factories and where the learning opportunities exist (and against which dimension of the model).
2. The perception problem in manufacturing processes and management practice:
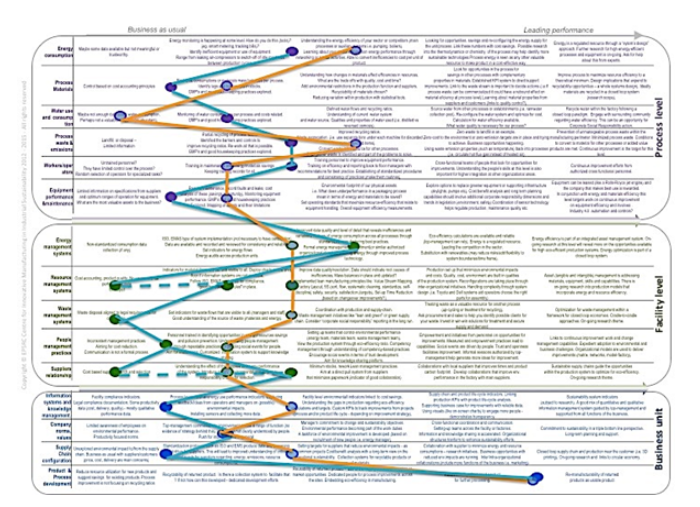
The following assessment is performed in a leading aerospace company where two senior engineering managers (green and orange lines) find it difficult to agree on the maturity of different practices currently used at the factory level as part of their environmental sustainability strategy.
This assessment was part of the following use case:
| The self-assessment was completed by the head of environment and one of his associates in the same function. These two practitioners work closely together and are based in the UK headquarters. Even though the maturity profiles do not vary significantly (1 level plus or minus) it is clear that there is very little overall agreement on the maturity levels in each dimension. |
3. Using the maturity model as a consensus building tool in a factory:
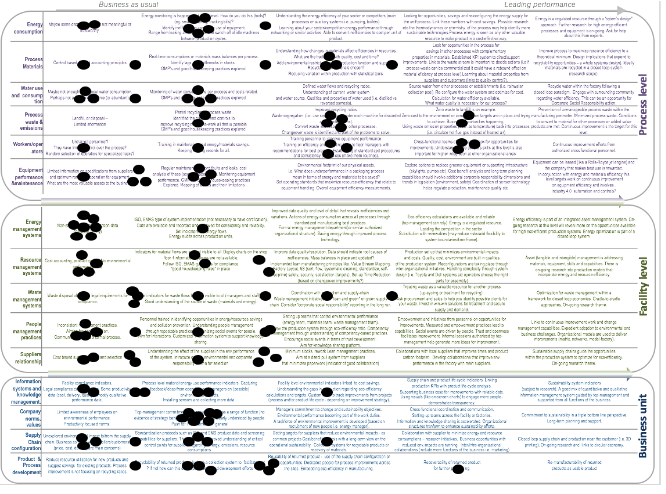
| Seven practitioners from different parts of the business (engineering, operations, marketing, health and safety etc.) were brought together to understand how they think the factory performs. The convergence between perceptions was very small and this would indicate high levels of resistance to change and continuous improvement. For example, if senior managers think they are doing really well, they will not invest time and effort in better practices and technologies.
A timeline (today +5years) was used to understand where they think they are today and where they want to be tomorrow. This can be one of the ways of thinking about improvements that need to occur, starting with areas of interest that are underperforming and developing the right projects to address the gaps. |
References:
Appendix:
1. High resolution picture of the maturity model for printing (also available here: Litos, L. (2016). Design support for eco-efficiency improvements in manufacturing p. 218.)
This work is licensed under a Creative Commons Attribution-ShareAlike 4.0 International License.
Any views, thoughts, and opinions expressed herein are solely that of the author(s) and do not necessarily reflect the views, opinions, policies, or position of the Engineering Professors’ Council or the Toolkit sponsors and supporters.
To view a plain text version of this resource, click here to download the PDF.
