Earlier this month, the OfS published a new release of degree classification data, concluding that the growing proportion of the first and upper second class degrees awarded cannot be fully explained by factors linked with degree attainment. Specifically, the new analysis finds that in 2017-18, 13.9 percentage points’ worth of first-class degree attainment is unexplained by changes in the graduate population since 2010-11, an increase of 2.4 percentage points from the unexplained attainment in 2016-17. So we have it – grade inflation.
So, we’ve fished some unfiltered HESA data out of our archives, updated it, and looked at the distributions between first, second and third-class honours in engineering. And it seems that engineering paints a very different (worse?) picture than the sector as a whole. We award a notably higher proportion of firsts and, at a glance, a commensurately lower proportion of 2nd class honours. The proportion of 3rd class honours/pass awarded has come into line with the all subjects over recent years. It varies by engineering discipline, but nowhere is the proportion of firsts lower than for all subjects.
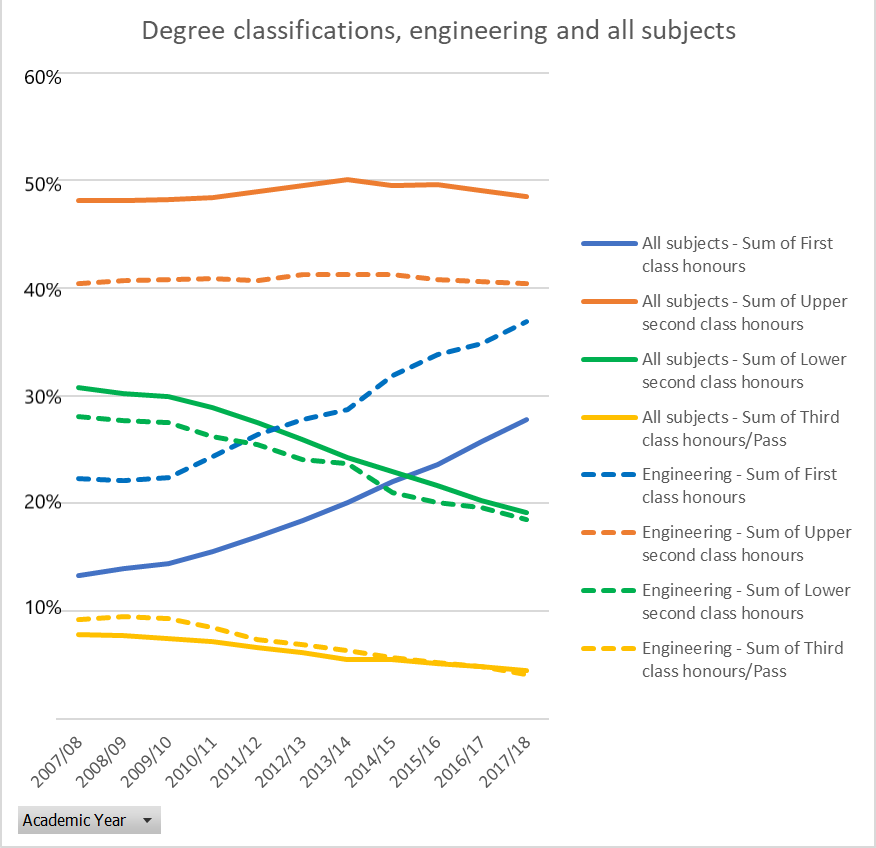
You might think, then, that high-level degree awards in engineering (firsts plus upper-class seconds) were nothing to write home about. But in 2016/17, at 77.3%, the proportion of high-level degree awards in engineering was one percentage point higher than for all subjects (and the difference has fluctuated around the one percent mark for the past ten years).
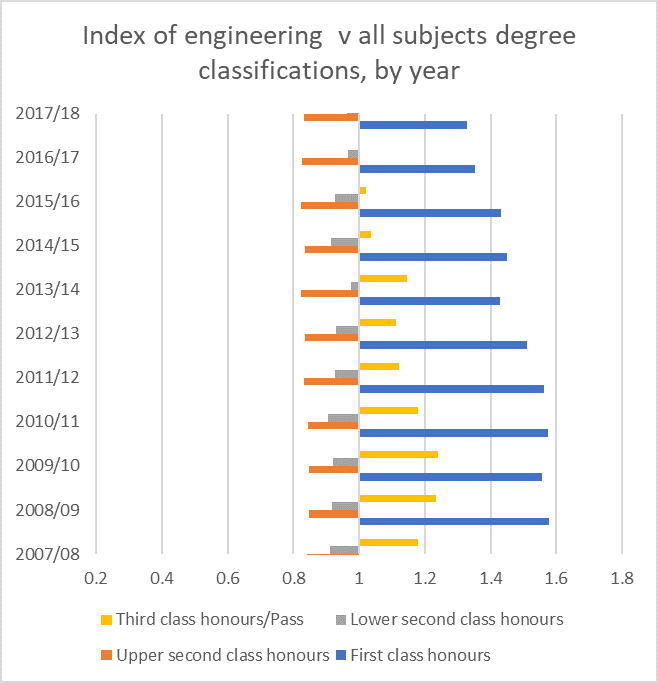
A simplified index plot, where 1 (the central y axis) represents all subjects, shows the propensity of a first in engineering is consistently greater than for all subjects (where the longer the bar, the greater the over-representation). The over-representation of firsts in engineering has shown a notable reduction over the past ten years and, at 1.4, was at its lowest yet in 2017/18. The overrepresentation of third-class honours in engineering visible from 2007/08 to 2015/15 has now been eliminated. You can see from this analysis that the over-representation of firsts is in fact greater than the combined under-representation of 2:1s and 2:2s.
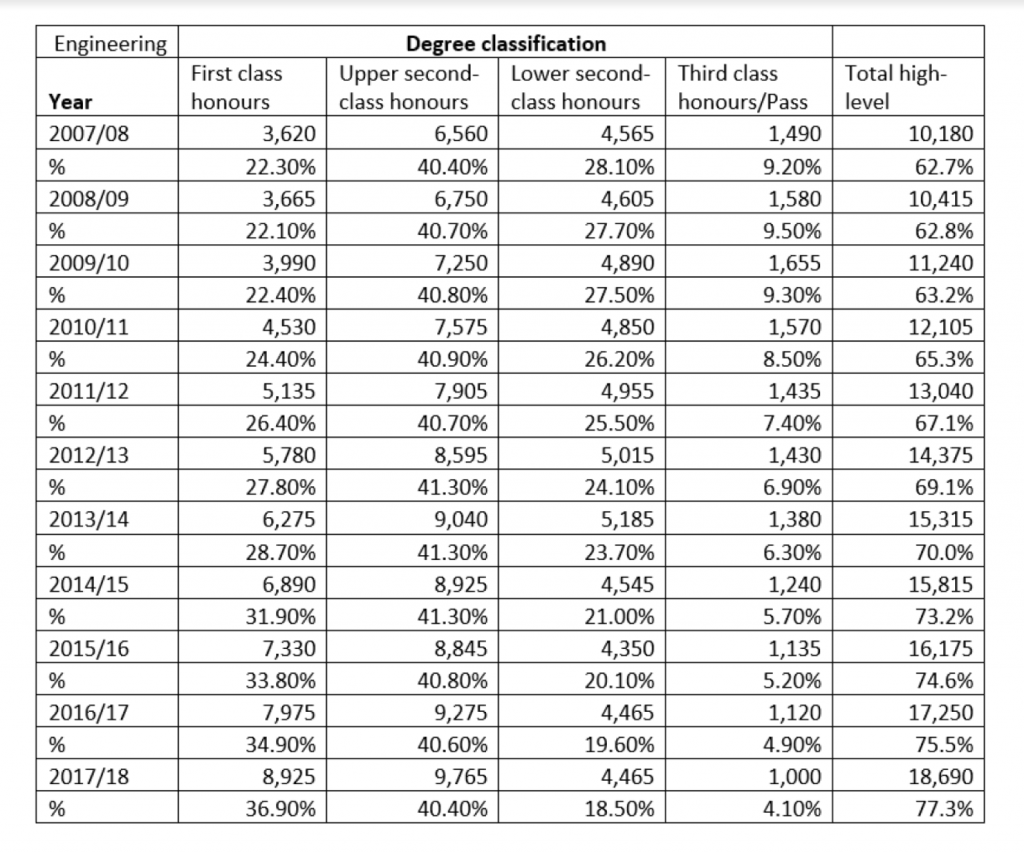
So, what does this tell us? That the rise in higher degree classifications doesn’t apply to engineering? The number of high-level degrees in engineering has increased from 10,180 in 2007/8 to 18,690 in 2017/8, an increase of 83.6%. Proportionally, this has risen from 62.7% of all degree awards in engineering to 77.3%. That’s just marginally less proportional growth than the 14.9 percentage point difference for all subjects. But we are making progress.
Here’s the rub, who’s to say that rises in high-level degree classifications (which, sector-wide, cannot be explained by the data readily available – not my data) is necessarily a problem per se, or that is signals grade inflation? There are many reasons – not accounted for in the OfS statistical models – for degree outcome uplift, not least the massive expansion of student numbers in the last 20 years (leading to a less socially constrained pool of students); greater awareness of student support needs; the increased cost of higher education to students; more incentivised and focused students; and improved teaching in both schools and universities. Further, there is evidence that market forces; course enrolments; progression rules (e.g. progression from BEng to MEng requires achievement of marks for the first two or three years of study suggesting a minimum 2:1 standard, and therefore likely transfer of the best students away from the BEng); and the marking processes adopted by different subject areas impacts the proportion of upper degrees between subjects.
The evidence of improvement in teaching (and the development of pedagogy in UK universities) is much stronger than the evidence for grade inflation. As a discipline, this is what we must celebrate. Higher education (HE) is the gold standard in the delivery of engineering skills in the UK and has a strong international standing and reputation.
Let’s face it, the assumption that institutions need to account for grade inflation rather than educational improvement is perverse. Instead, let’s talk about and encourage innovation in teaching, learning and assessment, precisely what our New Approaches to Engineering Higher Education initiative (in partnership with the IET) aims to do. Earlier this year we launched six case study examples for each of the six new approaches, evidencing that the required changes can be achieved – are already being achieved – and we now want other institutions who have been inspired to come up with new approaches of their own to showcase their work at a New Approaches conference at the IET in November. More details will be circulated shortly.
Attribution: EPC analysis of HESA Student Qualifiers Full Person Equivalent (FPE) using Heidi Plus Online Analytics service.